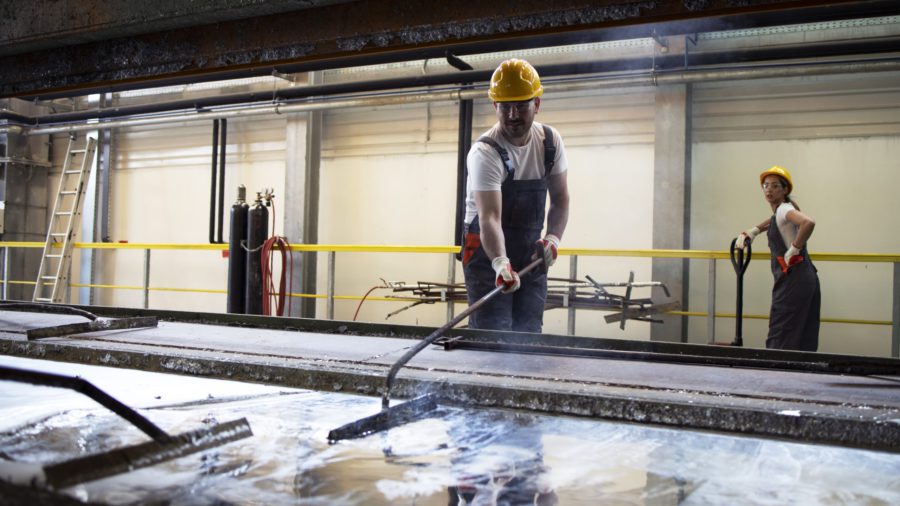
Five vital commodity industries are buckling under energy crisis Energy-intensive sectors such as steel, fertilizers, and aluminum are being forced to close factories or pass on soaring costs. Bloomberg News | August 18, 2022 | 5:50 am
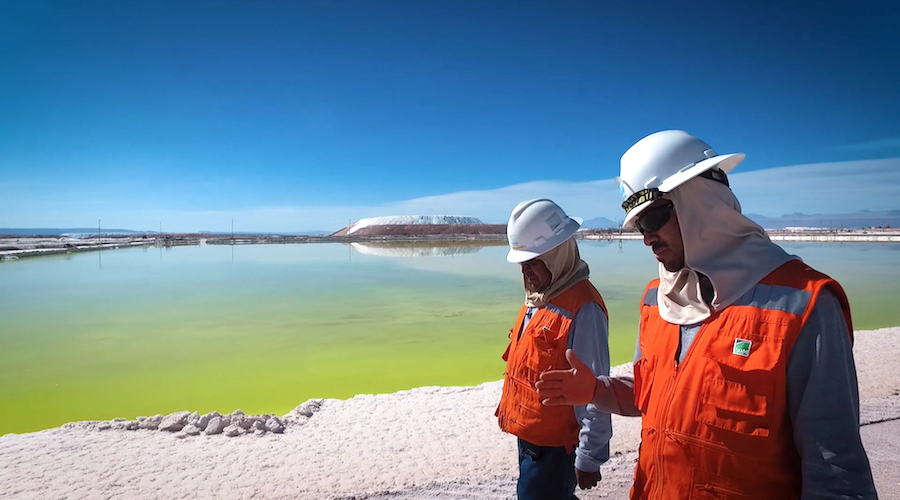
SQM reports near ten-fold jump in Q2 net profit The miner's net profit was $859.3 million for the quarter, up from $89.8 million a year earlier. Reuters | August 18, 2022 | 5:34 am
China ramping up Swiss gold imports, signaling better demand China shipped in more than 80 tonnes from Switzerland in July. Bloomberg News | August 18, 2022 | 5:30 am
Gold price seen rising above $2,000 on inflation, mining veteran says “The market is going to have to get used to inflation numbers being much higher for longer,” said Jake Klein, executive chairman at Evolution Mining. Bloomberg News | August 18, 2022 | 5:15 am
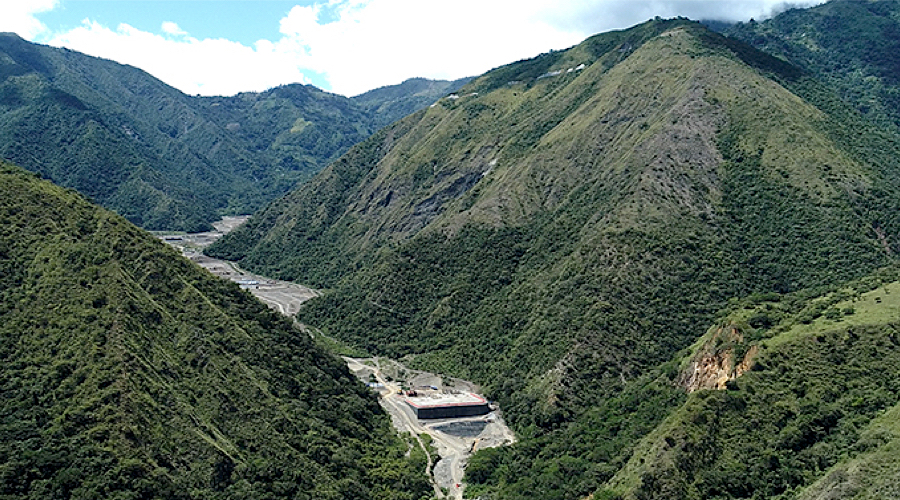
Zijin Colombia mine search uncovers no bodies, local officials Roadblocks were set up by the community around the mine in Buritica to demand a rescue mission. Reuters | August 18, 2022 | 5:06 am
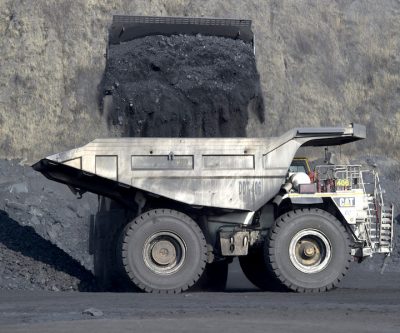
Column: Iron ore’s short-term outlook at odds with longer optimism It's likely that keeping iron ore above $100 a tonne will require some actual evidence that the bullish narrative is starting to kick in, writes Clyde Russell. Reuters | August 18, 2022 | 5:02 am
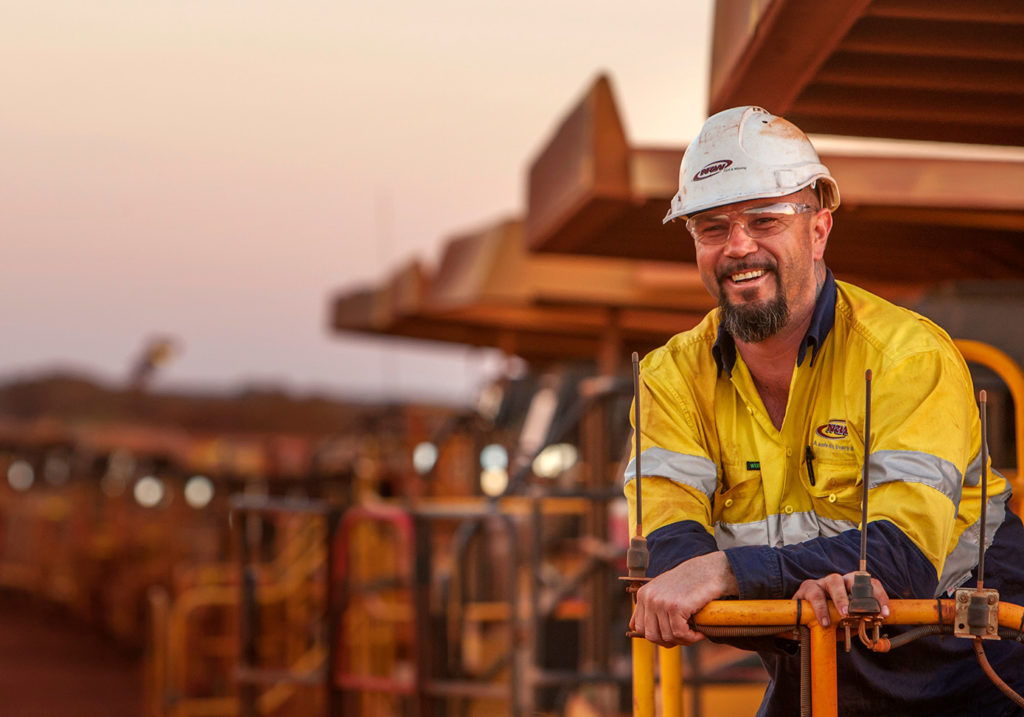
NRW Holdings says MACA rebuffs $260m buyout offer Australian mining services provider plans to proceed with a proposal from rival contractor Thiess. Reuters | August 18, 2022 | 4:47 am
Thungela agrees to amend rail contract with Transnet Transnet declared force majeure and sought to terminate long-term coal transportation agreements in April. Reuters | August 18, 2022 | 4:40 am
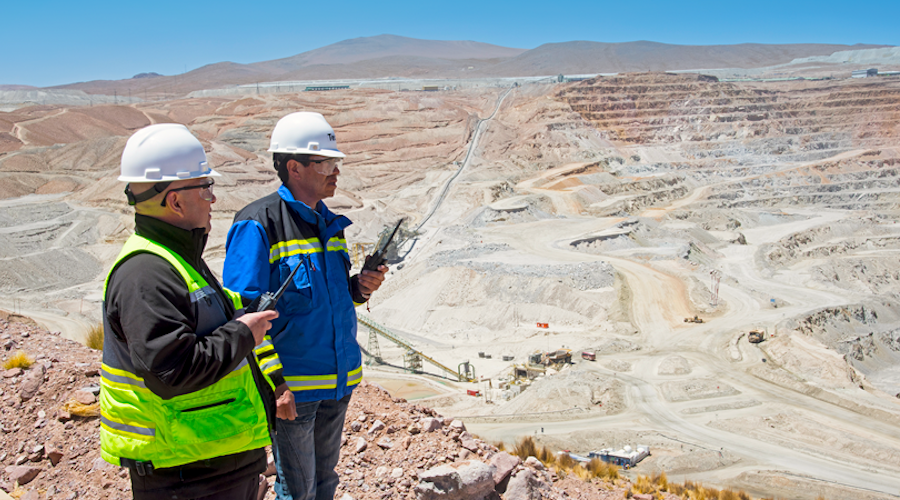
Teck and Chile discuss investments, royalties Teck has stability agreements for QB2, which protects it against changes in tax laws for 15 years from the start of production. Cecilia Jamasmie | August 18, 2022 | 3:40 am