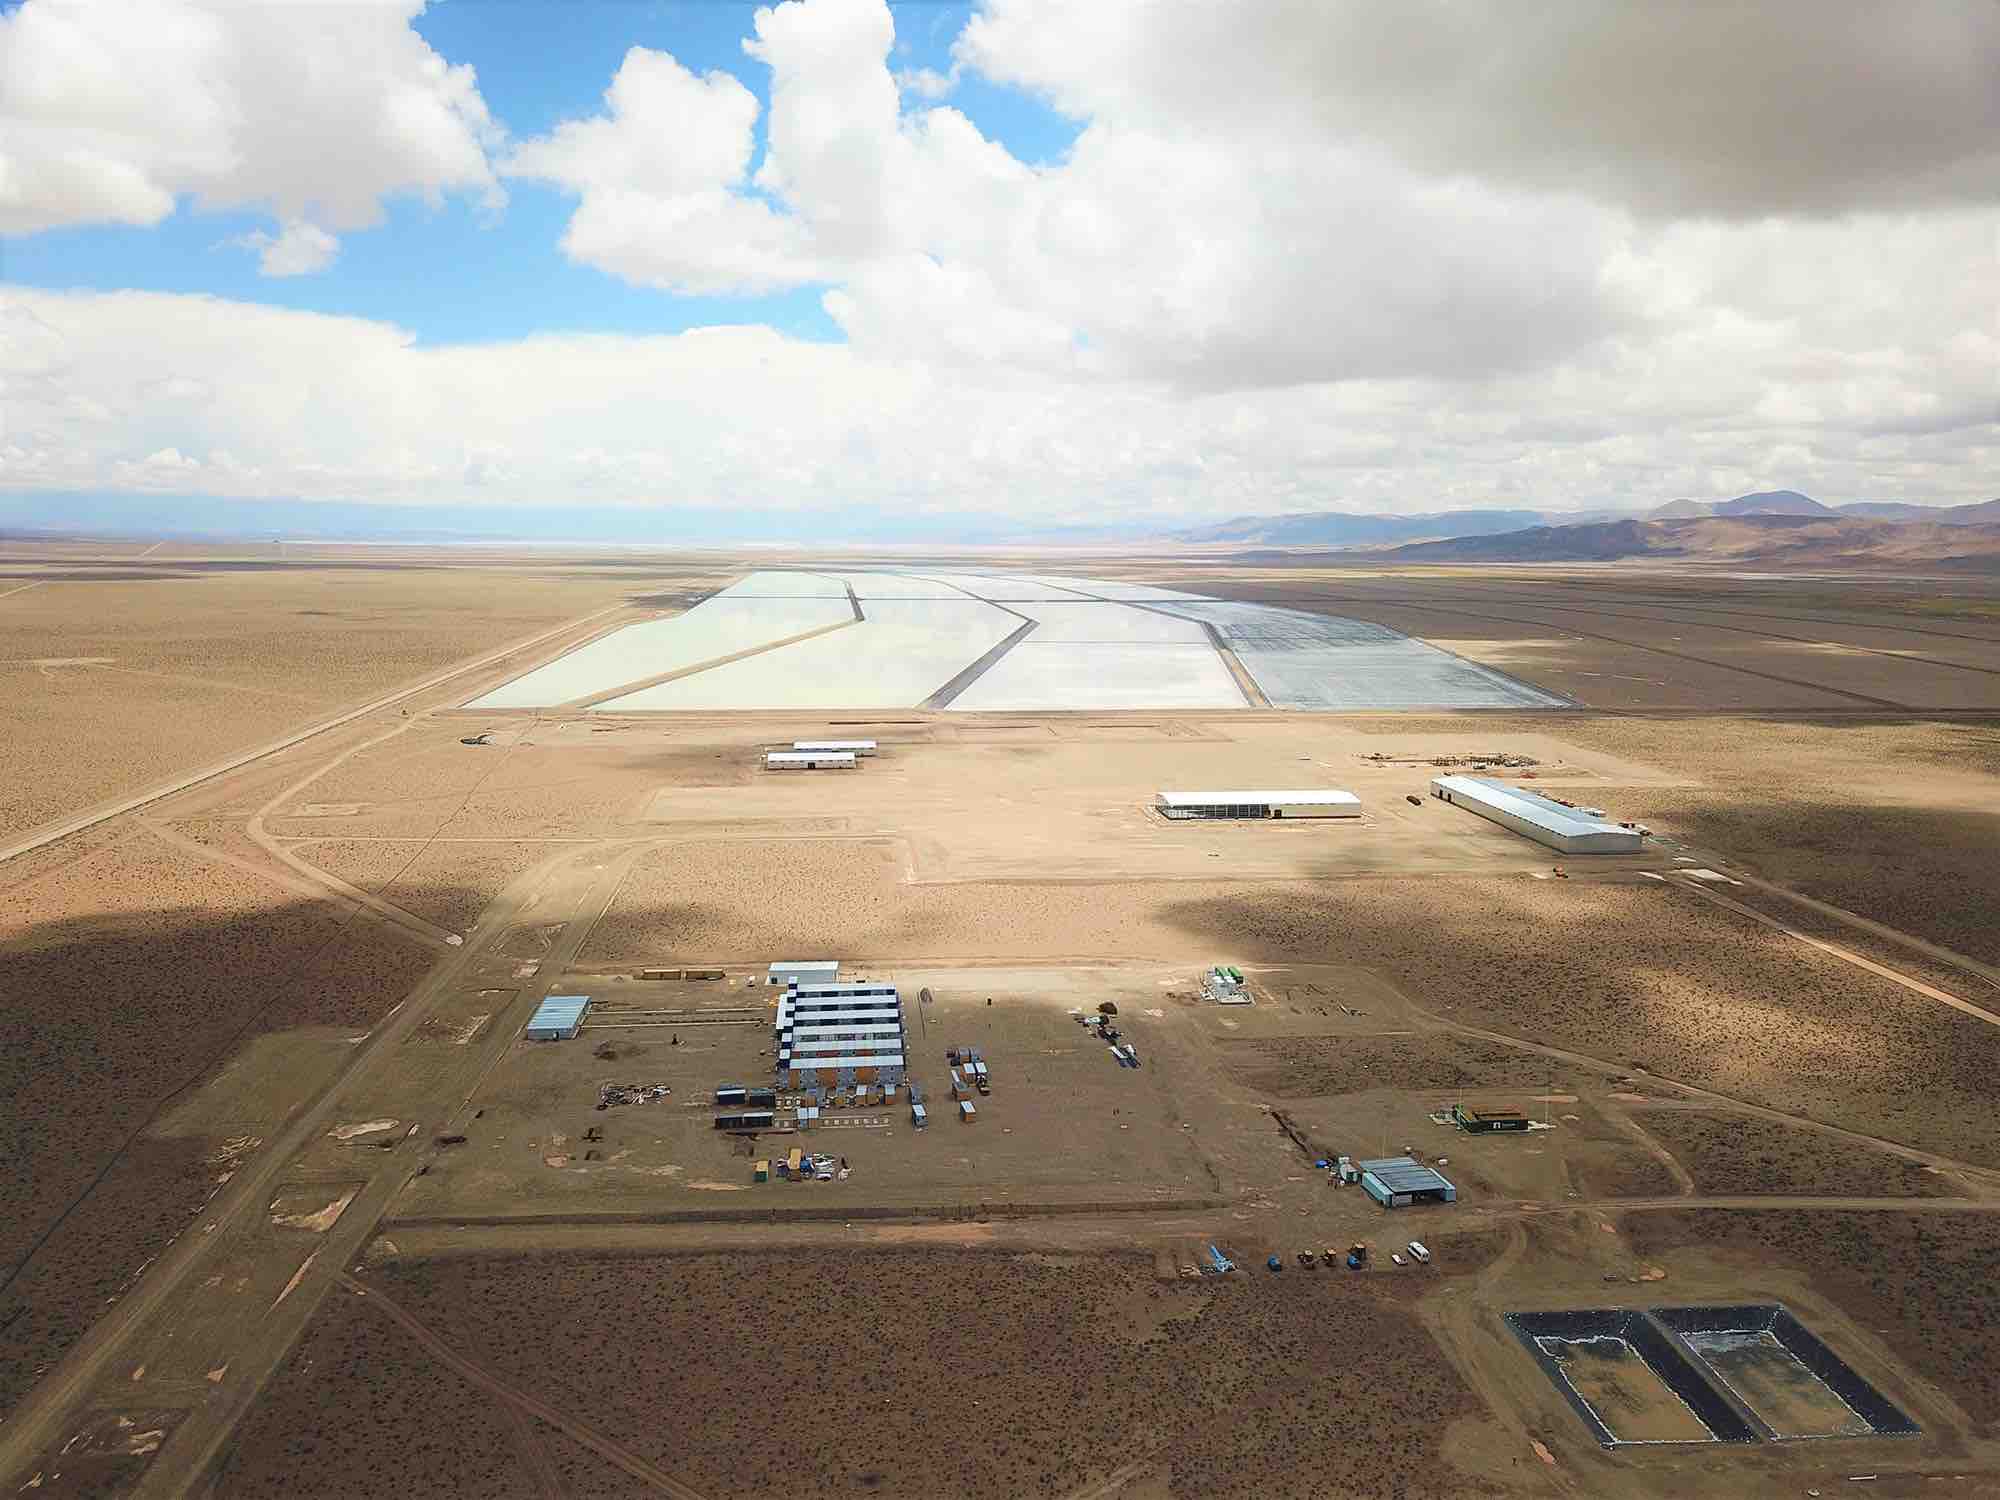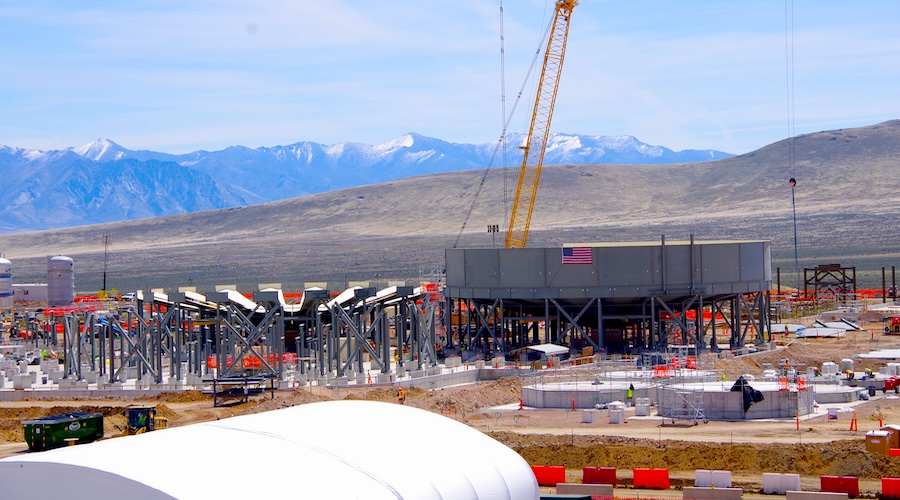
Lithium Americas boosts Thacker Pass spending
The Thacker Pass project is becoming a test case for the US to quickly build a lithium industry to rival China's dominance.

(in U.S. dollars unless otherwise noted)
TORONTO, March 10, 2026 /CNW/ -
Strong Finish to the Year
2025 was a record-breaking year for Franco-Nevada driven by higher precious metal prices and growing production. "We achieved the top end of our revised 2025 GEO guidance range thanks to a strong fourth quarter", stated Paul Brink, CEO. "The record increase in our annual cash flow allowed us to announce a 16% dividend increase in January this year. 2025 joined 2024 as two of our best-ever years for capital deployment. That success has continued post year-end and we have announced four further attractive acquisitions, all of which add additional optionality and create real value for shareholders rather than simply adding scale. Our 2026 guidance and the five-year outlook point to a strong growth foundation and the tremendous amount of exploration capital expected to be spent by operators on projects in our deep royalty portfolio is set to provide powerful additional organic growth. A restart of Cobre Panama would add significant further growth, and the Panamanian Government's willingness to approve the processing of stockpiles is a positive step in that direction. With the industry's largest portfolio of gold royalties, no debt and $3.1 billion in available capital we are uniquely positioned to continue to create shareholder value."
Financial Highlights – Q4 2025 compared to Q4 2024
Financial Highlights – 2025 compared to 2024
GEOs Sold and Revenue
Quarterly GEOs sold and revenue by commodity | |||||||||||
Q4 2025 | Q4 2024 | ||||||||||
GEOs Sold | Revenue | GEOs Sold | Revenue | ||||||||
# | (in millions) | # | (in millions) | ||||||||
PRECIOUS METALS | |||||||||||
Gold | 101,140 | $ | 422.3 | 79,532 | $ | 211.6 | |||||
Silver | 24,078 | 102.4 | 13,689 | 36.2 | |||||||
PGM | 2,741 | 12.8 | 2,344 | 6.5 | |||||||
127,959 | $ | 537.5 | 95,565 | $ | 254.3 | ||||||
DIVERSIFIED | |||||||||||
Iron ore | 2,175 | $ | 9.0 | 4,330 | $ | 11.6 | |||||
Other mining assets | 589 | 2.4 | 332 | 0.8 | |||||||
Oil | 6,254 | 22.9 | 14,317 | 34.0 | |||||||
Gas | 3,217 | 16.8 | 3,700 | 12.6 | |||||||
NGL | 1,462 | 4.2 | 1,819 | 5.3 | |||||||
13,697 | $ | 55.3 | 24,498 | $ | 64.3 | ||||||
GEOs and revenue from royalty, stream and working interests | 141,656 | $ | 592.8 | 120,063 | $ | 318.6 | |||||
Interest revenue and other interest income | -- | $ | 4.5 | -- | $ | 2.4 | |||||
Total GEOs and revenue | 141,656 | $ | 597.3 | 120,063 | $ | 321.0 | |||||
Annual GEOs sold and revenue by commodity | |||||||||||
2025 | 2024 | ||||||||||
GEOs Sold | Revenue | GEOs Sold | Revenue | ||||||||
# | (in millions) | # | (in millions) | ||||||||
PRECIOUS METALS | |||||||||||
Gold | 366,265 | $ | 1,275.8 | 295,193 | $ | 706.9 | |||||
Silver | 63,697 | 235.6 | 48,489 | 117.8 | |||||||
PGM | 10,178 | 37.3 | 11,628 | 28.3 | |||||||
440,140 | $ | 1,548.7 | 355,310 | $ | 853.0 | ||||||
DIVERSIFIED | |||||||||||
Iron ore | 12,711 | $ | 43.7 | 22,314 | $ | 50.5 | |||||
Other mining assets | 3,804 | 12.4 | 3,555 | 8.2 | |||||||
Oil | 39,665 | 118.8 | 59,030 | 128.6 | |||||||
Gas | 15,294 | 65.4 | 15,147 | 44.1 | |||||||
NGL | 7,492 | 19.6 | 7,978 | 20.3 | |||||||
78,966 | $ | 259.9 | 108,024 | $ | 251.7 | ||||||
GEOs and revenue from royalty, stream and working interests | 519,106 | $ | 1,808.6 | 463,334 | $ | 1,104.7 | |||||
Interest revenue and other interest income | -- | $ | 14.2 | -- | $ | 8.9 | |||||
Total GEOs and revenue | 519,106 | $ | 1,822.8 | 463,334 | $ | 1,113.6 | |||||
In Q4 2025, we recognized revenue of $597.3 million, an increase of 86% from Q4 2024, and sold 141,656 GEOs, an increase of 18% from Q4 2024. We benefited from record gold and silver prices during the quarter, strong production from Antamina and South Arturo, and contributions from Precious Metal assets which were acquired or commenced production over the past year. Revenue from our Diversified assets was lower than in Q4 2024, due to lower oil prices. The outperformance of the gold price relative to our other commodities also resulted in a reduction in GEOs reported from our Diversified assets.
Precious Metal assets accounted for 90% of our revenue in Q4 2025 (71% gold, 17% silver, and 2% PGM). Revenue was sourced 89% from the Americas (44% South America, 21% Canada, 15% U.S. and 9% Central America & Mexico).
Portfolio Additions
Cobre Panamá Update
Cobre Panamá remains in a phase of Preservation and Safe Management ("P&SM") with production halted. During Q4 2025, as part of the P&SM plan approved by the government of Panama (the "GOP"), the power plant was restarted, with Unit 2 hot-commissioned and synchronized to the national grid and the commissioning of Unit 1 ongoing. In addition, the integral audit, carried out by SGS Global, is ongoing and is anticipated to be concluded in April 2026.
In January 2026, President José Raúl Mulino announced that the GOP will authorize the removal, processing and export of stockpiled ore. First Quantum awaits formal approvals to undertake these activities, which will be carried out in coordination with the GOP and in strict compliance with the P&SM plan. The processing of stockpiled ore does not constitute a mine reopening. On a preliminary basis, it is currently anticipated that processing of stockpiled ore could commence about three months after receiving official regulatory notice to proceed and would require approximately one year to process the stockpiled ore. Approximately 70,000 tonnes of copper is expected to be produced from the stockpiled ore which would result in the delivery of approximately 23,100 gold ounces and 265,000 silver ounces to Franco-Nevada. As the processing of the stockpiled ore is pending formal approval by the GOP, these GEOs are not included in our 2026 guidance. Timing of the receipt of such deliveries depends on the timing of formal approval by the GOP.
Sustainability Updates
We continue to demonstrate strong sustainability performance and rank highly among leading ESG rating agencies, including recognition by Sustainalytics as a Global ESG Leader for 2026 and being named by Corporate Knights as one of the 2026 Global 100 Most Sustainable Corporations. In Q4 2025, our community contributions included advancing multi-year community investments to support reforestation and community infrastructure at Tocantinzinho in Brazil in partnership with G Mining Ventures, and supporting an anti-anemia health initiative at Antapaccay in Peru with Glencore.
Dividend Increase for 2026
As previously announced on January 12, 2026, Franco-Nevada raised its quarterly dividend to US$0.44 per share and declared a quarterly dividend payable on March 26, 2026 to shareholders of record on March 12, 2026. This is a 16% increase from the previous US$0.38 per share quarterly dividend and marks the 19th consecutive annual increase for Franco-Nevada shareholders. The increased dividend is intended to be effective for the full 2026 fiscal year. Canadian investors in Franco-Nevada's IPO in December 2007 are now receiving an effective 16.1% yield on their cost base.
Guidance and Outlook
Our 2026 guidance and five-year outlook are based on assumptions including the forecasted state of operations from our assets based on the public statements and other disclosures by the third-party owners and operators of the underlying properties and our assessment thereof.
Our 2026 guidance and five-year outlook are based on the following assumed commodity prices: $4,500/oz Au, $75.00/oz Ag, $2,000/oz Pt, $1,650/oz Pd, $100/tonne Fe 62% CFR China, $70/bbl WTI oil and $3.00/mcf Henry Hub natural gas.
2026 Guidance
Beginning in 2026, we will be adopting fixed GEO conversion ratios based on the pricing assumptions outlined in our 2026 guidance. This methodology replaces our previous variable GEO conversion ratios based on prevailing market prices and is intended to make our GEO guidance better reflect production volumes.
Our Total GEOs are expected to range from 510,000 to 570,000 ounces, with approximately 90% from Precious Metal assets and 10% from our Diversified assets. The anticipated increase in our Precious Metal GEOs reflects the first full year of contribution from Côté Gold, Porcupine, and Valentine Gold, the continued ramp-up of Salares Norte and Greenstone, and the recent acquisitions of the Casa Berardi stream and i-80 royalty. With respect to our Diversified revenue, the commodity breakdown is expected to be approximately 50% oil and liquids, 25% natural gas and 25% iron ore and other minerals.
We have not assumed any contributions from Cobre Panamá in our 2026 guidance. As further discussed above, First Quantum is awaiting formal approval to process stockpiled ore, which would produce approximately 70,000 tonnes of copper and result in stream deliveries to Franco-Nevada of approximately 23,100 gold ounces and 265,000 silver ounces. The timing of stream deliveries would depend on when formal approval is received.
Given the volatility in commodity prices, we are also providing volume-based guidance for our Precious Metal assets. The table below presents our guidance for 2026:
2026 GEO Sales Guidance (1) (2) | 2025 Actual | ||||||
Commodity | |||||||
Gold ounces sold | 360,000 to 400,000 ounces | 366,265 gold ounces | |||||
Silver ounces sold | 4.7 to 5.5 million ounces | 5.4 million silver ounces | |||||
PGMs ounces sold | 32,000 to 37,000 ounces | 28,374 PGMs ounces | |||||
Diversified revenue | $245 to $285 million | $259.9 million | |||||
Gold Equivalent Ounces Sold | |||||||
Total | 510,000 to 570,000 GEOs | 519,106 GEOs |
1. | Our 2026 guidance assumes the following commodity prices: $4,500/oz Au, $75.00/oz Ag, $2,000/oz Pt, $1,650/oz Pd, $100/tonne Fe 62% CFR China, $70/bbl WTI oil and $3.00/mcf Henry Hub natural gas. Starting in 2026, actual GEOs will be calculated based on fixed conversion ratios based on the prices assumed in this 2026 guidance. |
2. | Our guidance and outlook reflect contributions from acquisitions we entered into subsequent to year-end as of the date of this news release but does not reflect any incremental revenue from additional contributions we may make to the Royalty Acquisition Venture with Continental. Our guidance and outlook do not reflect any buyback options which may be exercised at the discretion of our operators with the exception of the Cascabel buybacks as further detailed below. |
Five-Year Outlook
For 2030, we expect Total GEOs to range between 555,000 and 615,000 GEOs. Our outlook assumes the start of production at Cascabel, Copper World, Eskay Creek, Stibnite Gold and Rebecca-Roe. It also reflects planned expansions at Detour Lake, Magino and Castle Mountain Phase 2, and the development of the Coroccohuayco project at Antapaccay. These production increases are expected to be partly offset by the step-down at Candelaria and Antapaccay, and a decrease in production at Subika (Ahafo South). For our Energy assets, we anticipate continued production growth at our Haynesville, SCOOP/STACK and Permian interests, and expect steady-state production from our Canadian assets.
We have not assumed any contributions from Cobre Panamá in our five-year outlook. Should production restart, there is potential for materially higher GEOs, depending on the conditions of such restart. Based on the average of the next five years of the Cobre Panamá mine plan which was in place at the time of suspension, the stream has the potential to contribute as much as 150,000 to 175,000 GEOs to Franco-Nevada annually once the mine has ramped up to full capacity.
Q4 2025 Portfolio Updates
Precious Metal assets: GEOs sold from our Precious Metal assets were 127,959 GEOs, an increase of 34% from 95,565 GEOs in Q4 2024. This was primarily due to robust production at Antamina and South Arturo, and contributions from our recently acquired interests in Côté Gold, Western Limb, and Porcupine.
South America:
Central America & Mexico:
Canada:
U.S.:
Rest of World:
Diversified assets: Our Diversified assets, primarily comprising our Iron Ore and Energy interests, generated $55.3 million in revenue, compared to $64.3 million in Q4 2024. When converted to GEOs, our Diversified assets contributed 13,697 GEOs, compared to 24,498 GEOs in Q4 2024.
Other Mining:
Energy:
Shareholder Information and Details for 2025 Year-End Conference Call
The complete Consolidated Financial Statements and Management's Discussion and Analysis can be found on our website at www.franco-nevada.com, on SEDAR+ at www.sedarplus.com and on EDGAR at www.sec.gov.
We will host a conference call to review our 2025 year-end results. Interested investors are invited to participate as follows:
Conference Call and Webcast: | March 11th 10:00 am ET |
Dial‑in Numbers: | Toll‑Free: 1-888-510-2154 International: 437-900-0527 |
Conference Call URL (This allows participants to join the conference call by phone without operator assistance.Participants will receive an automated call back afterentering their name and phone number): | |
Webcast: | |
Replay (available until March 18th): | Toll‑Free: 1-888-660-6345 International: 289-819-1450 Pass code: 83241# |
Corporate Summary
Franco-Nevada Corporation is the leading gold-focused royalty and streaming company with the largest and most diversified portfolio of cash-flow producing assets. Its business model provides investors with gold price and exploration optionality while limiting exposure to cost inflation. Franco-Nevada is debt-free and uses its free cash flow to expand its portfolio and pay dividends. It trades under the symbol FNV on both the Toronto and New York stock exchanges. Franco-Nevada is the gold investment that works.
Forward-Looking Statements
This news release contains "forward-looking information" and "forward-looking statements" within the meaning of applicable Canadian securities laws and the United States Private Securities Litigation Reform Act of 1995, respectively, which may include, but are not limited to, statements with respect to future events or future performance, management's expectations regarding Franco-Nevada's growth, results of operations, estimated future revenues, performance guidance, carrying value of assets, future dividends and requirements for additional capital, mineral resources and mineral reserves estimates, production estimates, production costs and revenue, future demand for and prices of commodities, expected mining sequences, business prospects and opportunities, the performance and plans of third party operators, any ongoing or future audits being conducted by the Canada Revenue Agency ("CRA"), the expected exposure for current and future tax assessments and available remedies, and statements with respect to the future status and any potential restart of the Cobre Panamá mine and related arbitration proceedings. In addition, statements relating to mineral resources and mineral reserves, GEOs or mine lives are forward-looking statements, as they involve implied assessment, based on certain estimates and assumptions, and no assurance can be given that the estimates and assumptions are accurate and that such mineral resources and mineral reserves, GEOs or mine lives will be realized. Such forward-looking statements reflect management's current beliefs and are based on information currently available to management. Often, but not always, forward-looking statements can be identified by the use of words such as "plans", "expects", "is expected", "budgets", "potential for", "scheduled", "estimates", "forecasts", "predicts", "projects", "intends", "targets", "aims", "anticipates" or "believes" or variations (including negative variations) of such words and phrases or may be identified by statements to the effect that certain actions "may", "could", "should", "would", "might" or "will" be taken, occur or be achieved. Forward-looking statements involve known and unknown risks, uncertainties and other factors, which may cause the actual results, performance or achievements of Franco-Nevada to be materially different from any future results, performance or achievements expressed or implied by the forward-looking statements. A number of factors could cause actual events or results to differ materially from any forward-looking statement, including, without limitation: fluctuations in the prices of the primary commodities that drive royalty and stream revenue (gold, platinum group metals, copper, nickel, uranium, silver, iron-ore and oil and gas); fluctuations in the value of the Canadian and Australian dollar, Brazilian real, Mexican peso and any other currency in which revenue is generated, relative to the U.S. dollar; changes in national and local government legislation, including permitting and licensing regimes and taxation policies and the enforcement thereof; proposed tariff and other trade measures that may be imposed by the United States and proposed retaliatory measures that may be adopted by its trading partners; the adoption and implementation of a global minimum tax on corporations; regulatory, political or economic developments in any of the countries where properties in which Franco-Nevada holds a royalty, stream or other interest are located or through which they are held; risks related to the operators of the properties in which Franco-Nevada holds a royalty, stream or other interest, including changes in the ownership and control of such operators; relinquishment or sale of mineral properties; influence of macroeconomic developments; business opportunities that become available to, or are pursued by Franco-Nevada; reduced access to debt and equity capital; litigation; title, permit or license disputes related to interests on any of the properties in which Franco-Nevada holds a royalty, stream or other interest; whether or not the Company is determined to have "passive foreign investment company" ("PFIC") status as defined in Section 1297 of the United States Internal Revenue Code of 1986, as amended; potential changes in Canadian tax treatment of offshore streams; excessive cost escalation as well as development, permitting, infrastructure, operating or technical difficulties on any of the properties in which Franco-Nevada holds a royalty, stream or other interest; access to sufficient pipeline capacity; actual mineral content may differ from the mineral resources and mineral reserves contained in technical reports; rate and timing of production differences from mineral resource estimates, other technical reports and mine plans; risks and hazards associated with the business of development and mining on any of the properties in which Franco-Nevada holds a royalty, stream or other interest, including, but not limited to unusual or unexpected geological and metallurgical conditions, slope failures or cave-ins, sinkholes, flooding and other natural disasters, terrorism, civil unrest or an outbreak of contagious disease; the impact of future pandemics; and the integration of acquired assets. The forward-looking statements contained herein are based upon assumptions management believes to be reasonable, including, without limitation: the ongoing operation of the properties in which Franco-Nevada holds a royalty, stream or other interest by the owners or operators of such properties in a manner consistent with past practice; the accuracy of public statements and disclosures made by the owners or operators of such underlying properties; no material adverse change in the market price of the commodities that underlie the asset portfolio; the Company's ongoing income and assets relating to determination of its PFIC status; no material changes to existing tax treatment; the expected application of tax laws and regulations by taxation authorities; the expected assessment and outcome of any audit by any taxation authority; no adverse development in respect of any significant property in which Franco-Nevada holds a royalty, stream or other interest; the accuracy of publicly disclosed expectations for the development of underlying properties that are not yet in production; integration of acquired assets; and the absence of any other factors that could cause actions, events or results to differ from those anticipated, estimated or intended. However, there can be no assurance that forward-looking statements will prove to be accurate, as actual results and future events could differ materially from those anticipated in such statements. Investors are cautioned that forward-looking statements are not guarantees of future performance. In addition, there can be no assurance as to (i) the outcome of any ongoing or future audits by the CRA or the Company's exposure as a result thereof, or (ii) the future status and any potential restart of the Cobre Panamá mine or the outcome of any related arbitration proceedings. Franco-Nevada cannot assure investors that actual results will be consistent with these forward-looking statements. Accordingly, investors should not place undue reliance on forward-looking statements due to the inherent uncertainty therein.
For additional information with respect to risks, uncertainties and assumptions, please refer to Franco-Nevada's most recent Annual Information Form as well as Franco-Nevada's most recent Management's Discussion and Analysis filed with the Canadian securities regulatory authorities on www.sedarplus.com and Franco-Nevada's most recent Annual Report filed on Form 40-F filed with the SEC on www.sec.gov. The forward-looking statements herein are made as of the date hereof only and Franco-Nevada does not assume any obligation to update or revise them to reflect new information, estimates or opinions, future events or results or otherwise, except as required by applicable law.
ENDNOTES:
Calculation of Net Gold Equivalent Ounces:
(expressed in millions, excepts GEOs and Average Gold Price) | Q1 2025 | Q2 2025 | Q3 2025 | Q4 2025 | For the year ended December 31, 2025 | ||||||||||||||
GEOs | 126,585 | 112,093 | 138,772 | 141,656 | 519,106 | ||||||||||||||
Less: | |||||||||||||||||||
Cash Costs | $ | 38.5 | $ | 33.5 | $ | 47.2 | $ | 49.6 | $ | 168.8 | |||||||||
Divided by: Average gold price per ounce | $ | 2,863 | $ | 3,279 | $ | 3,456 | $ | 4,145 | $ | 3,425 | |||||||||
13,447 | 10,217 | 13,657 | 11,966 | 49,287 | |||||||||||||||
Net GEOs | 113,138 | 101,876 | 125,115 | 129,690 | 469,819 | ||||||||||||||
(expressed in millions, excepts GEOs and Average Gold Price) | Q1 2024 | Q2 2024 | Q3 2024 | Q4 2024 | For the year endedDecember 31, 2024 | ||||||||||||||
GEOs | 122,897 | 110,264 | 110,110 | 120,063 | 463,334 | ||||||||||||||
Less: | |||||||||||||||||||
Cash Costs | $ | 33.6 | $ | 29.1 | $ | 31.9 | $ | 34.4 | $ | 129.0 | |||||||||
Divided by: Average gold price per ounce | $ | 2,072 | $ | 2,338 | $ | 2,477 | $ | 2,662 | $ | 2,369 | |||||||||
16,216 | 12,447 | 12,878 | 12,923 | 54,464 | |||||||||||||||
Net GEOs | 106,681 | 97,817 | 97,232 | 107,140 | 408,870 |
2. NON-GAAP FINANCIAL MEASURES: Adjusted Net Income and Adjusted Net Income per share, Adjusted Net Income Margin, Adjusted EBITDA and Adjusted EBITDA per share, and Adjusted EBITDA Margin are non-GAAP financial measures with no standardized meaning under International Financial Reporting Standards ("IFRS Accounting Standards") and might not be comparable to similar financial measures disclosed by other issuers. For a quantitative reconciliation of each non-GAAP financial measure to the most directly comparable financial measure under IFRS Accounting Standards, refer to the below tables. Further information relating to these non-GAAP financial measures is incorporated by reference from the "Non-GAAP Financial Measures" section of Franco-Nevada's MD&A for the year ended December 31, 2025 dated March 10, 2026 filed with the Canadian securities regulatory authorities on SEDAR+ available at www.sedarplus.com and with the U.S. Securities and Exchange Commission available on EDGAR at www.sec.gov.
Reconciliation of Non-GAAP Financial Measures:
For the three months ended | For the year ended | |||||||||||||||
December 31, | December 31, | |||||||||||||||
(expressed in millions, except per share amounts) | 2025 | 2024 | 2025 | 2024 | ||||||||||||
Net income | $ | 367.7 | $ | 175.4 | $ | 1,112.1 | $ | 552.1 | ||||||||
Impairment reversal | -- | -- | (4.8) | -- | ||||||||||||
Gain on disposal of royalty interests | -- | -- | -- | (0.3) | ||||||||||||
Foreign exchange (gain) loss and other (income) expenses | (12.7) | 8.0 | (36.7) | 20.7 | ||||||||||||
Tax effect of adjustments | 1.2 | (0.4) | 4.6 | (2.4) | ||||||||||||
Other tax related adjustments | ||||||||||||||||
Deferred tax expense related to the remeasurement of deferred tax liability due to changes in Barbados tax rate | -- | -- | -- | 49.1 | ||||||||||||
Change in unrecognized deferred income tax assets | -- | 0.3 | -- | (1.1) | ||||||||||||
Adjusted Net Income | $ | 356.2 | $ | 183.3 | $ | 1,075.2 | $ | 618.1 | ||||||||
Basic weighted average shares outstanding | 192.8 | 192.5 | 192.7 | 192.4 | ||||||||||||
Adjusted Net Income per share | $ | 1.85 | $ | 0.95 | $ | 5.58 | $ | 3.21 | ||||||||
For the three months ended | For the year ended | |||||||||||||||
December 31, | December 31, | |||||||||||||||
(expressed in millions, except Adjusted Net Income Margin) | 2025 | 2024 | 2025 | 2024 | ||||||||||||
Adjusted Net Income | $ | 356.2 | $ | 183.3 | $ | 1,075.2 | $ | 618.1 | ||||||||
Revenue | 597.3 | 321.0 | 1,822.8 | 1,113.6 | ||||||||||||
Adjusted Net Income Margin | 59.6 | % | 57.1 | % | 59.0 | % | 55.5 | % | ||||||||
For the three months ended | For the year ended | |||||||||||||||
December 31, | December 31, | |||||||||||||||
(expressed in millions, except per share amounts) | 2025 | 2024 | 2025 | 2024 | ||||||||||||
Net income | $ | 367.7 | $ | 175.4 | $ | 1,112.1 | $ | 552.1 | ||||||||
Income tax expense | 100.6 | 46.8 | 303.9 | 211.8 | ||||||||||||
Finance expenses | 0.8 | 0.7 | 3.1 | 2.6 | ||||||||||||
Finance income | (2.5) | (13.5) | (28.2) | (60.6) | ||||||||||||
Depletion and depreciation | 87.3 | 60.0 | 306.7 | 225.3 | ||||||||||||
Impairment reversal | -- | -- | (4.8) | -- | ||||||||||||
Gain on disposal of royalty interests | -- | -- | -- | (0.3) | ||||||||||||
Foreign exchange (gain) loss and other (income) expenses | (12.7) | 8.0 | (36.7) | 20.7 | ||||||||||||
Adjusted EBITDA | $ | 541.2 | $ | 277.4 | $ | 1,656.1 | $ | 951.6 | ||||||||
Basic weighted average shares outstanding | 192.8 | 192.5 | 192.7 | 192.4 | ||||||||||||
Adjusted EBITDA per share | $ | 2.81 | $ | 1.44 | $ | 8.59 | $ | 4.95 | ||||||||
For the three months ended | For the year ended | |||||||||||||||
December 31, | December 31, | |||||||||||||||
(expressed in millions, except Adjusted EBITDA Margin) | 2025 | 2024 | 2025 | 2024 | ||||||||||||
Adjusted EBITDA | $ | 541.2 | $ | 277.4 | $ | 1,656.1 | $ | 951.6 | ||||||||
Revenue | 597.3 | 321.0 | 1,822.8 | 1,113.6 | ||||||||||||
Adjusted EBITDA Margin | 90.6 | % | 86.4 | % | 90.9 | % | 85.5 | % | ||||||||
3. AVAILABLE CAPITAL: Available Capital comprises our cash and cash equivalents of $670.9 million as at December 31, 2025, our equity investments (excluding our long-term investment in Labrador Iron Ore Company of Canada) of $967.3 million as at December 31, 2025, the amount available to borrow under our $1.0 billion revolving credit facility and its accordion of $500.0 million as of the date of this news release.
FRANCO-NEVADA CORPORATION CONSOLIDATED STATEMENTS OF FINANCIAL POSITION (in millions of U.S. dollars)
At December 31, | At December 31, | |||||||
2025 | 2024 | |||||||
ASSETS | ||||||||
Cash and cash equivalents | $ | 670.9 | $ | 1,451.3 | ||||
Receivables | 241.9 | 151.8 | ||||||
Gold and silver bullion and stream inventory | 40.1 | 96.8 | ||||||
Loans receivable | -- | 5.9 | ||||||
Other current assets | 68.5 | 11.0 | ||||||
Current assets | $ | 1,021.4 | $ | 1,716.8 | ||||
Royalty, stream and working interests, net | $ | 6,043.1 | $ | 4,098.8 | ||||
Investments | 1,141.3 | 325.5 | ||||||
Loans receivable | -- | 104.1 | ||||||
Deferred income tax assets | 23.2 | 30.8 | ||||||
Other assets | 12.4 | 54.4 | ||||||
Total assets | $ | 8,241.4 | $ | 6,330.4 | ||||
LIABILITIES | ||||||||
Accounts payable and accrued liabilities | $ | 44.9 | $ | 28.7 | ||||
Income tax liabilities | 78.1 | 38.8 | ||||||
Current liabilities | $ | 123.0 | $ | 67.5 | ||||
Deferred income tax liabilities | $ | 440.7 | $ | 238.0 | ||||
Income tax liabilities | 33.8 | 19.8 | ||||||
Other liabilities | 8.6 | 8.5 | ||||||
Total liabilities | $ | 606.1 | $ | 333.8 | ||||
SHAREHOLDERS' EQUITY | ||||||||
Share capital | $ | 5,803.4 | $ | 5,769.1 | ||||
Contributed surplus | 21.6 | 23.0 | ||||||
Retained earnings | 1,379.8 | 486.5 | ||||||
Accumulated other comprehensive gain (loss) | 430.5 | (282.0) | ||||||
Total shareholders' equity | $ | 7,635.3 | $ | 5,996.6 | ||||
Total liabilities and shareholders' equity | $ | 8,241.4 | $ | 6,330.4 | ||||
The consolidated financial statements and accompanying notes can be found in our 2025 Annual Report available on our website
FRANCO-NEVADA CORPORATION CONSOLIDATED STATEMENTS OF INCOME AND COMPREHENSIVE INCOME (in millions of U.S. dollars and shares, except per share amounts)
For the three months ended | For the year ended | ||||||||||||||
December 31, | December 31, | ||||||||||||||
2025 | 2024 | 2025 | 2024 | ||||||||||||
Revenue | |||||||||||||||
Revenue from royalty, streams and working interests | $ | 592.8 | $ | 318.6 | $ | 1,808.6 | $ | 1,104.7 | |||||||
Interest revenue | 4.5 | 2.4 | 14.2 | 8.3 | |||||||||||
Other interest income | -- | -- | -- | 0.6 | |||||||||||
Total revenue | $ | 597.3 | $ | 321.0 | $ | 1,822.8 | $ | 1,113.6 | |||||||
Costs of sales | |||||||||||||||
Costs of sales | $ | 49.6 | $ | 34.4 | $ | 168.8 | $ | 129.0 | |||||||
Depletion and depreciation | 87.3 | 60.0 | 306.7 | 225.3 | |||||||||||
Total costs of sales | $ | 136.9 | $ | 94.4 | $ | 475.5 | $ | 354.3 | |||||||
Gross profit | $ | 460.4 | $ | 226.6 | $ | 1,347.3 | $ | 759.3 | |||||||
Other operating expenses (income) | |||||||||||||||
General and administrative expenses | $ | 7.7 | $ | 11.0 | $ | 35.3 | $ | 32.9 | |||||||
Share-based compensation expenses | 0.7 | 1.0 | 16.9 | 8.0 | |||||||||||
Impairment reversal | -- | -- | (4.8) | -- | |||||||||||
Gain on disposal of royalty interests | -- | -- | -- | (0.3) | |||||||||||
Gain on sale of gold and silver bullion | (1.9) | (2.8) | (54.3) | (7.9) | |||||||||||
Total other operating (income) expenses | $ | 6.5 | $ | 9.2 | $ | (6.9) | $ | 32.7 | |||||||
Operating income | $ | 453.9 | $ | 217.4 | $ | 1,354.2 | $ | 726.6 | |||||||
Foreign exchange gain (loss) and other income (expenses) | $ | 12.7 | $ | (8.0) | $ | 36.7 | $ | (20.7) | |||||||
Income before finance items and income taxes | $ | 466.6 | $ | 209.4 | $ | 1,390.9 | $ | 705.9 | |||||||
Finance items | |||||||||||||||
Finance income | $ | 2.5 | $ | 13.5 | $ | 28.2 | $ | 60.6 | |||||||
Finance expenses | (0.8) | (0.7) | (3.1) | (2.6) | |||||||||||
Net income before income taxes | $ | 468.3 | $ | 222.2 | $ | 1,416.0 | $ | 763.9 | |||||||
Income tax expense | 100.6 | 46.8 | 303.9 | 211.8 | |||||||||||
Net income | $ | 367.7 | $ | 175.4 | $ | 1,112.1 | $ | 552.1 | |||||||
Other comprehensive income (loss), net of taxes | |||||||||||||||
Items that may be reclassified subsequently to profit and loss: | |||||||||||||||
Currency translation adjustment | $ | 45.4 | $ | (103.9) | $ | 91.2 | $ | (131.3) | |||||||
Items that will not be reclassified subsequently to profit and loss: | |||||||||||||||
Gain (loss) on changes in the fair value of equity investments | |||||||||||||||
at fair value through other comprehensive income ("FVTOCI"), | |||||||||||||||
net of income tax | 291.5 | (1.1) | 696.3 | 40.4 | |||||||||||
Other comprehensive income (loss), net of taxes | $ | 336.9 | $ | (105.0) | $ | 787.5 | $ | (90.9) | |||||||
Comprehensive income | $ | 704.6 | $ | 70.4 | $ | 1,899.6 | $ | 461.2 | |||||||
Earnings per share | |||||||||||||||
Basic | $ | 1.91 | $ | 0.91 | $ | 5.77 | $ | 2.87 | |||||||
Diluted | $ | 1.90 | $ | 0.91 | $ | 5.76 | $ | 2.87 | |||||||
Weighted average number of shares outstanding | |||||||||||||||
Basic | 192.8 | 192.5 | 192.7 | 192.4 | |||||||||||
Diluted | 193.2 | 192.5 | 193.0 | 192.6 | |||||||||||
The consolidated financial statements and accompanying notes can be found in our 2025 Annual Report available on our website
FRANCO-NEVADA CORPORATION CONSOLIDATED STATEMENTS OF CASH FLOWS (in millions of U.S. dollars)
For the three months ended | For the year ended | |||||||||||||||
December 31, | December 31, | |||||||||||||||
2025 | 2024 | 2025 | 2024 | |||||||||||||
Cash flows from operating activities | ||||||||||||||||
Net income | $ | 367.7 | $ | 175.4 | $ | 1,112.1 | $ | 552.1 | ||||||||
Adjustments to reconcile net income to net cash provided by operating activities: | ||||||||||||||||
Depletion and depreciation | 87.3 | 60.0 | 306.7 | 225.3 | ||||||||||||
Share-based compensation expenses | 1.5 | 1.2 | 6.3 | 5.4 | ||||||||||||
Impairment reversal | -- | -- | (4.8) | -- | ||||||||||||
Gain on disposal of royalty interests | -- | -- | -- | (0.3) | ||||||||||||
Unrealized foreign exchange loss | 2.5 | 5.0 | (10.4) | 12.9 | ||||||||||||
Deferred income tax expense | 25.2 | 2.3 | 108.1 | 66.3 | ||||||||||||
Gain on sale of gold and silver bullion | (1.9) | (2.8) | (54.3) | (7.9) | ||||||||||||
(Gain) loss on derivative financial instruments | (14.2) | 2.0 | (32.7) | 6.0 | ||||||||||||
Other non-cash items | (8.8) | 0.4 | (10.3) | (4.2) | ||||||||||||
Gold and silver bullion from royalties received in-kind | (55.4) | (20.3) | (117.0) | (72.7) | ||||||||||||
Proceeds from sale of gold and silver bullion | 12.4 | 13.3 | 221.0 | 42.6 | ||||||||||||
Changes in other assets | -- | -- | -- | (17.4) | ||||||||||||
Operating cash flows before changes in non-cash working capital | $ | 416.3 | $ | 236.5 | $ | 1,524.7 | $ | 808.1 | ||||||||
Changes in non-cash working capital: | ||||||||||||||||
Increase in receivables | $ | (51.2) | $ | (18.1) | $ | (90.1) | $ | (40.8) | ||||||||
(Increase) decrease in other current assets | 11.6 | 4.9 | (4.7) | 15.6 | ||||||||||||
Increase in accounts payable and accrued liabilities | 49.8 | 19.7 | 63.8 | 46.6 | ||||||||||||
Net cash provided by operating activities | $ | 426.5 | $ | 243.0 | $ | 1,493.7 | $ | 829.5 | ||||||||
Cash flows used in investing activities | ||||||||||||||||
Acquisition of royalty, stream and working interests | $ | (34.2) | $ | (4.3) | $ | (2,191.6) | $ | (406.0) | ||||||||
Proceeds from repayment of loan receivable | 104.1 | -- | 114.1 | 28.9 | ||||||||||||
Proceeds from sale of investments | -- | 9.3 | 109.9 | 23.3 | ||||||||||||
Acquisition of investments | (5.0) | (35.6) | (60.3) | (74.5) | ||||||||||||
Acquisition of property and equipment | (0.2) | (0.1) | (2.4) | (0.2) | ||||||||||||
Acquisition of energy well equipment | (0.6) | (0.4) | (2.7) | (1.8) | ||||||||||||
Advances of loans receivable | -- | -- | -- | (118.2) | ||||||||||||
Proceeds from disposal of royalty interests | -- | -- | -- | 11.2 | ||||||||||||
Net cash provided by (used in) investing activities | $ | 64.1 | $ | (31.1) | $ | (2,033.0) | $ | (537.3) | ||||||||
Cash flows used in financing activities | ||||||||||||||||
Payment of dividends | $ | (70.6) | $ | (62.1) | $ | (275.1) | $ | (242.4) | ||||||||
Proceeds from draw down of Corporate Revolver | -- | -- | 175.0 | -- | ||||||||||||
Repayment of Corporate Revolver | -- | -- | (175.0) | -- | ||||||||||||
Proceeds from exercise of stock options | 0.3 | 0.1 | 7.7 | 2.8 | ||||||||||||
Revolving credit facility amendment costs | -- | -- | -- | (0.8) | ||||||||||||
Net cash used in financing activities | $ | (70.3) | $ | (62.0) | $ | (267.4) | $ | (240.4) | ||||||||
Effect of exchange rate changes on cash and cash equivalents | $ | 13.9 | $ | (15.9) | $ | 26.3 | $ | (22.4) | ||||||||
Net change in cash and cash equivalents | $ | 434.2 | $ | 134.0 | $ | (780.4) | $ | 29.4 | ||||||||
Cash and cash equivalents at beginning of year | $ | 236.7 | $ | 1,317.3 | $ | 1,451.3 | $ | 1,421.9 | ||||||||
Cash and cash equivalents at end of year | $ | 670.9 | $ | 1,451.3 | $ | 670.9 | $ | 1,451.3 | ||||||||
Supplemental cash flow information: | ||||||||||||||||
Income taxes paid | $ | 22.0 | $ | 17.2 | $ | 162.0 | $ | 73.8 | ||||||||
Dividend income received | $ | 1.8 | $ | 3.3 | $ | 8.7 | $ | 12.6 | ||||||||
Interest and standby fees paid | $ | 1.4 | $ | 0.6 | $ | 4.0 | $ | 2.1 | ||||||||
The consolidated financial statements and accompanying notes can be found in our 2025 Annual Report available on our website
View original content:https://www.prnewswire.com/news-releases/franco-nevada-reports-record-2025-results-302710083.html
SOURCE Franco-Nevada Corporation
View original content: http://www.newswire.ca/en/releases/archive/March2026/10/c0252.html