Rio Tinto’s Kennecott copper mine suspends operations as contract worker dies
The death is the latest in a series of fatal incidents across a few of Rio's mines.

FOURTH QUARTER AND FULL YEAR FINANCIAL RESULTS
VANCOUVER, BC, March 12, 2026 /CNW/ - "Wheaton's portfolio of high-quality, long-life assets delivered another outstanding year in 2025, surpassing our production guidance and achieving record revenue, earnings, and operating cash flow," said Randy Smallwood, Chief Executive Officer of Wheaton Precious Metals. "Strong contributions from cornerstone assets including Salobo, Antamina, and Peñasquito, alongside the continued ramp-up of Blackwater and Goose, demonstrate the strength of our diversified streaming model. As I prepare to transition to the role of Chair of the Board, I have truly never been more excited about Wheaton's future and the portfolio's ability to continue delivering long-term value."
"These results reflect the consistent execution of our disciplined capital allocation strategy, focused on high-quality assets, well-structured agreements, strong counterparties, attractive margins, and long-term growth," added Haytham Hodaly, President of Wheaton Precious Metals. "In 2025, we strengthened our portfolio with the Hemlo and Spring Valley gold streams and, following year-end, announced the largest precious metals streaming transaction ever at Antamina in partnership with BHP. As I prepare to step into the role of Chief Executive Officer, I am confident in the foundation we have built and excited to lead Wheaton into its next phase of growth, focused on disciplined execution and sustainable value creation for all stakeholders."
Record Financial Performance and Strong Balance Sheet
High Quality Asset Base
Leadership in Sustainability
Operational Overview
(all figures in US dollars unless otherwise noted) | Q4 2025 | Q4 2024 | Change | 2025 | 2024 | Change | |||||||||||
Units produced | |||||||||||||||||
Gold ounces | 130,676 | 118,328 | 10.4 % | 416,171 | 381,248 | 9.2 % | |||||||||||
Silver ounces | 6,064 | 5,865 | 3.4 % | 22,289 | 20,959 | 6.3 % | |||||||||||
Palladium ounces | 2,519 | 2,797 | (9.9) % | 10,265 | 15,632 | (34.3) % | |||||||||||
Cobalt pounds | 670 | 393 | 70.4 % | 2,460 | 1,289 | 90.8 % | |||||||||||
Gold equivalent ounces 3 | 205,037 | 189,059 | 8.5 % | 689,864 | 635,488 | 8.6 % | |||||||||||
Units sold | |||||||||||||||||
Gold ounces | 121,791 | 87,662 | 38.9 % | 411,005 | 332,701 | 23.5 % | |||||||||||
Silver ounces | 5,685 | 4,307 | 32.0 % | 19,796 | 16,072 | 23.2 % | |||||||||||
Palladium ounces | 1,730 | 4,434 | (61.0) % | 9,356 | 17,270 | (45.8) % | |||||||||||
Cobalt pounds | 485 | 485 | 0.0 % | 1,632 | 970 | 68.2 % | |||||||||||
Gold equivalent ounces 3 | 190,535 | 141,495 | 34.7 % | 651,311 | 529,493 | 23.0 % | |||||||||||
Change in PBND | |||||||||||||||||
Gold equivalent ounces 3 | (968) | 31,853 | 32,821 | (15,013) | 49,756 | 64,769 | |||||||||||
Revenue | $ | 864,714 | $ | 380,516 | 127.2 % | $ | 2,314,600 | $ | 1,284,639 | 80.2 % | |||||||
Net earnings | $ | 558,250 | $ | 88,148 | 533.3 % | $ | 1,471,720 | $ | 529,140 | 178.1 % | |||||||
Per share | $ | 1.230 | $ | 0.194 | 534.0 % | $ | 3.242 | $ | 1.167 | 177.8 % | |||||||
Adjusted net earnings 1 | $ | 554,979 | $ | 198,969 | 178.9 % | $ | 1,372,862 | $ | 640,170 | 114.5 % | |||||||
Per share 1 | $ | 1.222 | $ | 0.439 | 178.4 % | $ | 3.025 | $ | 1.412 | 114.2 % | |||||||
Operating cash flows | $ | 746,277 | $ | 319,471 | 133.6 % | $ | 1,904,981 | $ | 1,027,581 | 85.4 % | |||||||
Per share 1 | $ | 1.644 | $ | 0.704 | 133.5 % | $ | 4.197 | $ | 2.266 | 85.2 % |
All amounts in thousands except gold, palladium & gold equivalent ounces, and per share amounts. |
Financial Review
Revenues
Revenue in the fourth quarter of 2025 was $865 million (59% gold, 39% silver, 1% palladium and 1% cobalt), with the $484 million increase relative to the prior period quarter being primarily due to a 69% increase in the average realized gold equivalent3 price; and a 35% increase in the number of GEOs3 sold.
Revenue was $2.3 billion (62% gold, 36% silver, 1% palladium and 1% cobalt) during the year ended December 31, 2025, with the $1.0 billion increase from 2024 due primarily to a 46% increase in the average realized gold equivalent3 price; and a 23% increase in the number of GEOs3 sold.
Cash Costs and Margin
Average cash costs¹ in the fourth quarter of 2025 were $597 per GEO3 as compared to $444 in the fourth quarter of 2024. This resulted in a cash operating margin¹ of $3,941 per GEO3 sold, an increase of 76% as compared with the fourth quarter of 2024, a result of the higher realized price per ounce. The higher margin reflects the leverage provided by fixed per-ounce production payments across the majority of Wheaton's operating streams, which accounted for 80% of revenue during the quarter. Notably, year-over-year margin growth exceeded the appreciation in gold prices over the same period, underscoring the effectiveness of Wheaton's business model in generating higher levered cash flow and margins in a rising precious metals price environment.
Average cash costs1 in 2025 were $514 per GEO3 as compared to $438 in 2024. This resulted in a cash operating margin1 of $3,040 per GEO3 sold, a 53% increase from 2024, a result of the higher realized price per ounce.
Cash Flow from Operations
Operating cash flow in the fourth quarter of 2025 amounted to $746 million, with the $427 million increase from the comparable period of the prior year being due primarily to higher gross margin.
Operating cash flows in 2025 amounted to $1.9 billion, with the $877 million increase from the comparable period of the previous year being due primarily to higher gross margin.
Produced But Not Yet Delivered
As at December 31, 2025, approximately 155,000 GEOs3 were produced but not yet delivered ("PBND") representing approximately 2.5 months of payable production. This reduction in the number of months of PBND compared with the preceding four quarters places PBND levels at the mid-point of our guided range of two and a half to three and a half months and was driven by a significant increase in quarterly sales volumes during the fourth quarter.
Balance Sheet (at December 31, 2025)
Fourth Quarter Operating Asset Highlights
Salobo: In the fourth quarter of 2025, Salobo produced 88,900 ounces of attributable gold, representing a quarterly record and an increase of approximately 5% relative to the fourth quarter of 2024, primarily the result of higher throughput and recoveries resulting from improved efficiencies at Salobo 1 and 2, partially offset by lower grades.
Antamina: In the fourth quarter of 2025, Antamina produced 1.6 million ounces of attributable silver, an increase of approximately 49% relative to the fourth quarter of 2024, primarily due to higher grades and recoveries.
Peñasquito: In the fourth quarter of 2025, Peñasquito produced 1.8 million ounces of attributable silver, a decrease of approximately 26% relative to the fourth quarter of 2024, primarily the result of lower grades with mining activities having transitioned back into the Peñasco pit which contains lower silver grades relative to the Chile Colorado pit, partially offset by higher recoveries. On February 19, 2026, Newmont Corporation ("Newmont") reported that silver production at Peñasquito is expected to increase in 2026, largely due to grades milled, including increased stockpile processing in 2026.
Constancia: In the fourth quarter of 2025, Constancia produced 0.7 million ounces of attributable silver and 15,400 ounces of attributable gold, a decrease of approximately 25% and 18%, respectively, relative to the fourth quarter of 2024, primarily due to lower gold and silver grades. On February 20, 2026, Hudbay Minerals Inc ("Hudbay") announced that Constancia is expected to deliver at higher mill throughput rates starting in the second half of 2026 with the installation of pebble crushers. Hudbay reported that 2026 gold production is expected to be lower than 2025 production, reflecting depletion of the Pampacancha pit in 2025.
San Dimas: In the fourth quarter of 2025, San Dimas produced 8,200 ounces of attributable gold, an increase of approximately 13% relative to the fourth quarter of 2024, with higher throughput being partially offset by the change of the gold to silver conversion ratio from 70:1 to 90:1, effective for the period April 30, 2025 to October 28, 2025. On October 29, 2025, the gold to silver conversion ratio returned to 70:1.
Stillwater: In the fourth quarter of 2025, the Stillwater mines produced 1,500 ounces of attributable gold and 2,500 ounces of attributable palladium, a decrease of approximately 30% for gold and 10% for palladium relative to the fourth quarter of 2024, primarily due to lower grades and recoveries.
Blackwater: In the fourth quarter of 2025, Blackwater produced 0.1 million ounces of attributable silver and 5,500 ounces of attributable gold, with the mine achieving commercial production in May 2025. On December 15, 2025, Artemis Gold Inc. ("Artemis Gold") announced that its board of directors approved an expanded Phase 2 development at the Blackwater mine. This Phase 2 development is a significant addition to the previously announced Phase 1A project, designed to increase nameplate capacity from 8 Mtpa to 21 Mtpa before the end of 2028.
On March 12, 2026, Artemis Gold reported an unplanned mill shutdown due to the failure of a ball mill gearbox, with the estimated time to complete repairs and restart mill operations between 8 to 10 days. Artemis Gold reports that plans are underway to make use of this interruption to carry out maintenance activities originally planned for Q2 2026. Artemis Gold notes that while mining related activities are continuing normally, production in Q1 2026 is expected to be lower than originally anticipated as a result of this mill outage.
Voisey's Bay: In the fourth quarter of 2025, the Voisey's Bay mine produced 670,000 pounds of attributable cobalt, an increase of approximately 70% relative to the fourth quarter of 2024 as the underground mine at Voisey's Bay continues ramp-up to full production, with full ramp-up expected by the second half of 2026.
Other Gold: In the fourth quarter of 2025, total Other Gold attributable production was 3,400 ounces, an increase of approximately 441% relative to the fourth quarter of 2024 due to the initial reported production from the Goose mine, which achieved commercial production on October 6, 2025, and the addition of attributable production from the Hemlo mine. Notable operational updates for assets included within 'Other Gold' include:
Other Silver: In the fourth quarter of 2025, total Other Silver attributable production was 1.8 million ounces, an increase of approximately 30% relative to the fourth quarter of 2024. Notable operational updates for assets included within 'Other Silver' include:
Detailed mine-by-mine production and sales figures can be found in the Appendix to this press release and in Wheaton's consolidated MD&A in the 'Results of Operations and Operational Review' section.
Recent Development Asset Updates
Mineral Park: During the quarter, Waterton Copper LP continued ore commissioning of the newly refurbished concentrator at its Mineral Park project. The ramp-up efforts in Q4 2025 were focused on mill alignment to handle increasing throughput and gradually increasing both operating uptime and overall site throughput. First concentrate sales occurred in Q4 2025 and first silver delivery to Wheaton occurred in January 2026. Ramp-up to commercial production is expected to continue in Q1 2026, with increasing concentrate production throughout the first quarter. At steady state throughput, the fully refurbished mill capacity will be 16.5 Mtpa.
Platreef: On January 12, 2026, Ivanhoe announced that following the official opening and first production of concentrate from the Platreef mine on November 18, 2025, the development of the mine continues to rapidly advance. During the initial ramp‑up period, lower‑grade development ore is being processed, with a transition to production ore expected once Shaft #3 is ready to hoist in early Q2 2026, at which time the concentrator is expected to achieve approximately 80 percent of nameplate capacity by mid‑year.
Fenix: On January 26, 2026, Rio2 Limited ("Rio2") announced the first official gold pour at the Fenix Gold Mine, where construction of critical path items were completed on time and on budget, as previously guided. Rio2 stated that the focus now is to ramp up operations to 20,000 tonnes per day of ore.
Kurmuk: On February 18, 2026, Allied Gold Corporation ("Allied") reported that the Kurmuk project was progressing in line with plan, with advancement at the processing plant and crushing circuit, mining activities supporting ore stockpiling, and power line construction advancing toward completion ahead of commissioning. A review of processing capacity was completed in Q4 2025, and the project is now being executed to accommodate average throughput of up to 6.4 Mtpa (from 6.0 Mtpa), with pre‑commissioning expected in 2026.
On January 26, 2026, Allied announced it has entered into a definitive agreement with Zijin Gold International Company Limited ("Zijin Gold"), where Zijin Gold will acquire all of the issued and outstanding shares of Allied in cash. Subject to the satisfaction or waiver by the parties of all necessary closing conditions and the receipt of all required approvals, the completion of the transaction is anticipated in late April 20269.
Koné: On January 19, 2026, Montage announced that rapid construction progress continues to be made at its Koné project, where first gold pour through the oxide circuit is anticipated in late Q4 2026, while the hard-rock comminution circuit remains well on track for completion in Q2 2027. Since commencement of the project, key milestones achieved include the erection of all 14 carbon-in-leach tanks, piperack and grid mesh walkways, completion of the oxide sizer and the delivery of the ball mill to site.
El Domo: On February 4, 2026, Silvercorp reported that during 2025, construction activities at its El Domo project advanced across site preparation, infrastructure, and water management works, with approximately $44.5 million spent (about 16% of their revised budget), including completion of archaeological clearance, significant earthworks and road construction, camp commissioning, and placement of orders for long‑lead time major equipment.
Copper World: On January 12, 2026, Hudbay announced the closing of the joint venture transaction with Mitsubishi Corporation, securing a premier, long-term strategic partner for the development of Copper World. Hudbay notes that they intend to complete the definitive feasibility study at Copper World in mid-2026 with final sanctioning decision expected in 2026.
Santo Domingo: On February 17, 2026, Capstone reported that they plan to progress the financing strategy, detailed engineering and infrastructure optimization opportunities at its Santo Domingo project towards a sanctioning decision expected in the second half of 2026.
Corporate Development
Spring Valley: On November 6, 2025, the Company entered into a PMPA (the "Spring Valley PMPA") with Waterton Gold Corp., a subsidiary of Waterton Gold LP, in respect of gold production from the Spring Valley project located in Nevada, USA ("Spring Valley"). Under the terms of the Spring Valley PMPA, the Company is committed to pay Waterton Gold total upfront cash consideration of $670 million in installments as various conditions are satisfied, with the initial payment being paid on December 11, 2025. The Company has also provided a cost overrun facility of up to $150 million, accessible during an availability period commencing once the full upfront consideration has been paid under the Spring Valley PMPA.
Hemlo: On November 26, 2025, the Company entered into a PMPA with Hemlo in respect of gold production from the currently operating Hemlo mine located in Ontario, Canada. Under the terms of the Hemlo PMPA, which will deliver immediate production and cash flow to the Company, the Company paid Hemlo total upfront cash consideration of $300 million.
As part of its financing commitment, on October 7, 2025 the Company invested $30 million (Cdn$42 million) in Hemlo's equity offering.
Antamina: On February 16, 2026, the Company announced it had entered into a definitive PMPA with BHP (the "BHP Antamina PMPA") for their 33.75% portion of the silver produced at the Antamina Mine located in Peru. Upon closing, Wheaton will receive a combined 67.5% of all the silver produced from Antamina, up from the 33.75% currently delivered under the existing Glencore Antamina silver stream.
Under the terms of the BHP Antamina PMPA, the Company will pay BHP total upfront cash consideration of $4.3 billion on closing, subject to certain customary conditions. Additionally, the Company will make ongoing payments for the silver ounces delivered equal to 20% of the spot price of silver. The BHP Antamina PMPA is effective April 1, 2026, from which time the Company will purchase BHP's 33.75% of the payable silver until a total of 100 million ounces has been delivered, at which point the Company will purchase 22.5% of the payable silver for the life of mine. Payable silver will be calculated using a fixed payable factor of 90.0%.
The upfront payment of $4.3 billion will be funded through a combination of existing liquidity and new financing. Funding sources include estimated cash on hand at closing of approximately $1.9 billion, including the $1.2 billion cash on hand at December 31, 2025 in addition to $323 million realized on the disposal of Long-Term Equity Investments. The remaining balance will be funded through an approximate $0.9 billion draw on the Company's Revolving Facility, in addition to a new $1.5 billion non-revolving term loan credit facility ("Term Loan") which carries a two-year maturity and aligns with the terms of the Company's existing Revolving Facility.
The Term Loan and the RCF provide flexible, non‑dilutive financing that may be repaid at any time without penalty. The remaining liquidity available from the RCF, in addition to continued strong cash flows, provides healthy balance sheet capacity. Net debt at closing of the BHP Antamina PMPA acquisition is currently expected to be approximately $2.4 billion, assuming estimated approximate incremental cash flows. With the liquidity provided by the remaining available credit under the $2 billion Revolving Facility coupled with the $500 million accordion and ongoing operating cash flows, the Company remains well positioned to fund all outstanding commitments, as well as providing flexibility to acquire additional accretive mineral stream interests.
Reserves and Resources (at December 31, 2025)
Proven and Probable Mineral Reserves attributable to Wheaton were 15.1 million ounces of gold compared with 15.4 million ounces as reported in Wheaton's 2024 Annual Information Form ("AIF"), a decrease of 2%; 556.1 million ounces of silver compared with 469.2 million ounces, an increase of 19%; 0.83 million ounces palladium, unchanged; 0.52 million ounces of platinum, unchanged; and 27.8 million pounds of cobalt compared to 30.6 million pounds, a decrease of 6%. On a GEO8 basis, total Proven and Probable Mineral Reserves for all metals attributable to Wheaton were 25.0 million ounces compared to 23.8 million ounces, an increase of 5%.
Measured and Indicated Mineral Resources attributable to Wheaton were 7.1 million ounces of gold compared with 6.8 million ounces as reported in Wheaton's 2024 AIF, an increase of 4%; 645.5 million ounces of silver compared with 704.6 million ounces, a decrease of 8%; 0.14 million ounces of palladium compared with 0.13 million ounces, an increase of 6%; 0.09 million ounces of platinum, unchanged; and 9.2 million pounds of cobalt compared to 1.2 million pounds of cobalt, an increase of 700%. On a GEO8 basis, total Measured and Indicated Mineral Resources for all metals attributable to Wheaton were 18.0 million ounces compared with 18.7 million ounces, a decrease of 4%.
Inferred Mineral Resources attributable to Wheaton were 4.6 million ounces of gold compared with 4.9 million ounces as reported in Wheaton's 2024 AIF, a decrease of 8%; 449.5 million ounces of silver compared with 330.1 million ounces, an increase of 36%, 0.34 million ounces of palladium, unchanged; 0.04 million ounces of platinum, unchanged; and 5.3 million pounds of cobalt compared with 7.4 million pounds, a decrease of 28%. On a GEO8 basis, total Inferred Mineral Resources for all metals attributable to Wheaton were 12.2 million ounces compared with 10.6 million ounces, an increase of 15%.
Estimated attributable reserves and resources contained in this press release are based on information available to the Company as of March 5, 2026, and therefore will not reflect updates, if any, after that date. Updated reserves and resources data incorporating year-end 2025 estimates will also be included in the Company's 2025 Annual Information Form. Wheaton's most current attributable reserves and resources, as of December 31, 2025, with attributable footnotes, can be found on the Company's website at www.wheatonpm.com.
Sustainability
Future of Mining Challenge
Subsequent to the quarter, Wheaton announced Cetos Water as the winner of the Future of Mining Challenge. Cetos Water has been awarded $1 million for its unique technology that turns wastewater from mining activities into clean, reusable water.
Corporate Knights Global 100
Subsequent to the quarter, Wheaton was named once again to Corporate Knights' 2026 Global 100 Most Sustainable Corporations list, marking its third consecutive year of recognition for leadership in sustainable value creation.
Community Investment Program
Subsequent Events
Chief Executive Officer Transition
On February 5, 2026, Wheaton announced that as part of the Company's strategic succession planning, Haytham Hodaly, currently President, will succeed Randy Smallwood as Wheaton's Chief Executive Officer, effective March 31, 2026, reflecting an ongoing leadership evolution to support the next phase in the Company's growth trajectory.
Declaration of Dividend
The Company has increased its quarterly dividend under its dividend policy, setting it at $0.195 per common share for 2026. This represents an 18% increase over the quarterly dividend paid in 2025 and represents the third consecutive year that the dividend has been increased, highlighting the Company's commitment to a progressive dividend. The declaration, timing, amount and payment of future dividends remain at the discretion of the Board of Directors.
2026 Production Outlook
For 2026, Wheaton provides annual production guidance of 860,000 to 940,000 GEOs8. This expected year-over-year growth is driven primarily by the additional stream at Antamina which is expected to add another 70,000 GEOs8 to the portfolio in 2026 and begin generating production on April 1, 2026. Further contributions from newly operating assets, including Blackwater, Mineral Park, Fenix, Hemlo, Goose and Platreef are also forecast to support this growth. These increases are expected to be partially offset by lower production from Constancia following the depletion of the Pampacancha pit in late December 2025.
At the Company's cornerstone assets, after achieving record production levels in 2025, attributable production levels at Salobo are forecast to decrease slightly, with higher throughput levels anticipated to be offset by modestly lower gold grades. Attributable production is forecast to increase significantly at Antamina in 2026 due to the additional stream, with the Company receiving a combined 67.5% of silver production commencing April 1, 2026, up from the 33.75% delivered in 2025 under the existing stream. Lastly, attributable production from Penasquito is forecast to increase from 2025, driven by stronger silver grades, including contributions from stockpile material as mining progresses through planned sequencing.
Long-Term Production Outlook
Production is forecast to increase by approximately 50% to 1,200,000 GEOs8 by 2030, due to growth from multiple Operating assets including Antamina, Blackwater, Aljustrel, Marmato, Hemlo and Goose; Development assets that are in construction and/or various stages of ramp-up, including the Koné, Fenix, Kurmuk, Platreef, Mineral Park and El Domo projects; and Pre-development assets including the Spring Valley, Copper World and Santo Domingo projects, all of which have received their major permits.
From 2031 to 2035, attributable production is forecast to be maintained at 1,200,000 GEOs8 annually and incorporates additional incremental production from Pre-development assets including the Cangrejos, Kudz ze Kayah and Marathon projects, in addition to the Mt. Todd and Black Pine royalties.
Not included in Wheaton's long-term forecast and instead classified as 'optionality', is potential future production from 11 other assets including El Alto, Navidad and Toroparu.
About Wheaton Precious Metals Corp.
Wheaton is the world's premier precious metals streaming company with the highest-quality portfolio of long-life, low-cost assets. Its business model offers investors commodity price leverage and exploration upside but with a much lower risk profile than a traditional mining company. Wheaton delivers amongst the highest cash operating margins in the mining industry, allowing it to pay a competitive dividend and continue to grow through accretive acquisitions. Wheaton is committed to strong ESG practices and giving back to the communities where Wheaton and its mining partners operate. Wheaton creates sustainable value through streaming for all of its stakeholders.
In accordance with Wheaton Precious Metals™ Corp.'s ("Wheaton Precious Metals", "Wheaton" or the "Company") MD&A and Financial Statements, reference to the Company and Wheaton includes the Company's wholly owned subsidiaries.
Webcast and Conference Call Details
A conference call will be held on Friday, March 13, 2026, starting at 11:00 am ET (8:00 am PT) to discuss these results. To participate in the live call, please use one of the following methods:
Dial toll free from Canada or the US: | 1-800-715-9871 |
Dial from outside Canada or the US: | 1-647-932-3411 |
Pass code: | 4433482# |
Live webcast: |
Participants should dial in five to ten minutes before the call.
The conference call will be recorded and available until March 20, 2026 at 11:59 pm ET. The webcast will be available for one year. You can listen to an archive of the call by one of the following methods:
Dial toll free from Canada or the US: | 1-800-770-2030 |
Dial from outside Canada or the US: | 1-647-362-9199 |
Pass code: | 4433482# |
Archived webcast: |
This earnings release should be read in conjunction with Wheaton Precious Metals' MD&A and Financial Statements, which are available on the Company's website at www.wheatonpm.com and have been posted on SEDAR+ at www.sedarplus.ca.
Wheaton Precious Metals believes that there are no significant differences between its corporate governance practices and those required to be followed by United States domestic issuers under the NYSE listing standards. This confirmation is located on the Wheaton Precious Metals website at http://www.wheatonpm.com.
Consolidated Statements of Earnings
Years Ended December 31 | |||||
(US dollars and shares in thousands, except per share amounts) | 2025 | 2024 | |||
Sales | $ | 2,314,600 | $ | 1,284,639 | |
Cost of sales | |||||
Cost of sales, excluding depletion | $ | 339,063 | $ | 235,108 | |
Depletion | 303,889 | 246,944 | |||
Total cost of sales | $ | 642,952 | $ | 482,052 | |
Gross margin | $ | 1,671,648 | $ | 802,587 | |
General and administrative | 46,767 | 40,668 | |||
Share based compensation | 32,504 | 23,268 | |||
Donations and community investments | 10,736 | 8,958 | |||
Impairment of mineral stream interests | - | 108,861 | |||
Earnings from operations | $ | 1,581,641 | $ | 620,832 | |
Gain on disposal of mineral stream interests | 85,724 | - | |||
Other income (expense) | 36,463 | 29,061 | |||
Earnings before finance costs and income taxes | $ | 1,703,828 | $ | 649,893 | |
Finance costs | 5,760 | 5,549 | |||
Earnings before income taxes | $ | 1,698,068 | $ | 644,344 | |
Income tax expense | 226,348 | 115,204 | |||
Net earnings | $ | 1,471,720 | $ | 529,140 | |
Basic earnings per share | $ | 3.242 | $ | 1.167 | |
Diluted earnings per share | $ | 3.237 | $ | 1.165 | |
Weighted average number of shares outstanding | |||||
Basic | 453,893 | 453,460 | |||
Diluted | 454,685 | 454,119 | |||
Consolidated Balance Sheets
As at December 31 | As at December 31 | |||
(US dollars in thousands) | 2025 | 2024 | ||
Assets | ||||
Current assets | ||||
Cash and cash equivalents | $ | 1,153,593 | $ | 818,166 |
Accounts receivable | 46,723 | 6,217 | ||
Other | 3,853 | 3,697 | ||
Total current assets | $ | 1,204,169 | $ | 828,080 |
Non-current assets | ||||
Mineral stream interests | $ | 7,397,149 | $ | 6,379,580 |
Early deposit mineral stream interests | 47,094 | 47,094 | ||
Mineral royalty interests | 40,421 | 40,421 | ||
Long-term equity investments | 410,495 | 98,975 | ||
Property, plant and equipment | 9,926 | 8,691 | ||
Other | 16,527 | 21,616 | ||
Total non-current assets | $ | 7,921,612 | $ | 6,596,377 |
Total assets | $ | 9,125,781 | $ | 7,424,457 |
Liabilities | ||||
Current liabilities | ||||
Accounts payable and accrued liabilities | $ | 22,557 | $ | 13,553 |
Income taxes payable | 109,951 | 2,127 | ||
Current portion of performance share units | 21,604 | 13,562 | ||
Current portion of lease liabilities | 575 | 262 | ||
Total current liabilities | $ | 154,687 | $ | 29,504 |
Non-current liabilities | ||||
Performance share units | $ | 13,215 | $ | 11,522 |
Lease liabilities | 7,330 | 4,909 | ||
Income taxes payable - non-current | 252,271 | 113,505 | ||
Deferred income taxes | 1,794 | 349 | ||
Pension liability | 5,976 | 5,289 | ||
Total non-current liabilities | $ | 280,586 | $ | 135,574 |
Total liabilities | $ | 435,273 | $ | 165,078 |
Shareholders' equity | ||||
Issued capital | $ | 3,814,910 | $ | 3,798,108 |
Reserves | 176,911 | (63,503) | ||
Retained earnings | 4,698,687 | 3,524,774 | ||
Total shareholders' equity | $ | 8,690,508 | $ | 7,259,379 |
Total liabilities and shareholders' equity | $ | 9,125,781 | $ | 7,424,457 |
Consolidated Statements of Cash Flows
Years Ended December 31 | |||||||
(US dollars in thousands) | 2025 | 2024 | |||||
Operating activities | |||||||
Net earnings | $ | 1,471,720 | $ | 529,140 | |||
Adjustments for | |||||||
Depreciation and depletion | 305,167 | 248,303 | |||||
Gain on disposal of mineral stream interest | (85,724) | - | |||||
Impairment of mineral stream interests | - | 108,861 | |||||
Equity settled share based compensation | 6,475 | 6,703 | |||||
Performance share units - expense | 26,029 | 16,565 | |||||
Performance share units - paid | (17,209) | (11,129) | |||||
Income tax expense | 226,348 | 115,204 | |||||
Investment income recognized in net earnings | (37,780) | (27,014) | |||||
Other | 8,931 | 4,515 | |||||
Change in non-cash working capital | (30,410) | 4,426 | |||||
Cash generated from operations before income taxes and interest | $ | 1,873,547 | $ | 995,574 | |||
Income taxes refunded (paid) | (3,645) | 8,516 | |||||
Interest paid | (429) | (287) | |||||
Interest received | 35,508 | 23,778 | |||||
Cash generated from operating activities | $ | 1,904,981 | $ | 1,027,581 | |||
Financing activities | |||||||
Credit facility extension fees | $ | (955) | $ | (937) | |||
Share purchase options exercised | 7,271 | 13,192 | |||||
Lease payments | (505) | (594) | |||||
Dividends paid | (296,367) | (279,050) | |||||
Cash used for financing activities | $ | (290,556) | $ | (267,389) | |||
Investing activities | |||||||
Mineral stream interests | $ | (1,341,369) | $ | (628,234) | |||
Repayment of mineral stream interests deposit | - | 13,250 | |||||
Mineral royalty interests | - | (26,981) | |||||
Net proceeds on disposal of mineral stream interests | 101,730 | - | |||||
Acquisition of long-term investments | (39,873) | (20,234) | |||||
Proceeds on disposal of long-term investments | - | 177,088 | |||||
Investment in subscription rights | - | (3,114) | |||||
Dividends received | 1,051 | 2,188 | |||||
Other | (682) | (2,266) | |||||
Cash used for investing activities | $ | (1,279,143) | $ | (488,303) | |||
Effect of exchange rate changes on cash and cash equivalents | $ | 145 | $ | (250) | |||
Increase in cash and cash equivalents | $ | 335,427 | $ | 271,639 | |||
Cash and cash equivalents, beginning of year | 818,166 | 546,527 | |||||
Cash and cash equivalents, end of year | $ | 1,153,593 | $ | 818,166 | |||
Summary of Units Produced
Q4 2025 | Q3 2025 | Q2 2025 | Q1 2025 | Q4 2024 | Q3 2024 | Q2 2024 | Q1 2024 | |
Gold ounces produced 2 | ||||||||
Salobo | 88,907 | 66,997 | 69,418 | 71,384 | 84,291 | 62,689 | 63,225 | 61,622 |
Sudbury 3 | 7,808 | 4,852 | 5,403 | 4,880 | 5,259 | 3,593 | 4,477 | 5,618 |
Constancia | 15,396 | 12,797 | 4,604 | 4,876 | 18,727 | 10,760 | 6,269 | 14,316 |
San Dimas 4 | 8,206 | 7,507 | 6,987 | 8,416 | 7,263 | 6,882 | 7,089 | 7,542 |
Stillwater 5 | 1,518 | 1,717 | 1,654 | 1,339 | 2,166 | 2,247 | 2,099 | 2,637 |
Blackwater | 5,479 | 4,879 | 4,050 | 1,017 | - | - | - | - |
Other | ||||||||
Marmato | 705 | 807 | 748 | 757 | 622 | 648 | 584 | 623 |
Goose | 1,027 | 387 | 19 | - | - | - | - | - |
Hemlo | 1,630 | - | - | - | - | - | - | - |
Total Other | 3,362 | 1,194 | 767 | 757 | 622 | 648 | 584 | 623 |
Total gold ounces produced | 130,676 | 99,943 | 92,883 | 92,669 | 118,328 | 86,819 | 83,743 | 92,358 |
Silver ounces produced 2 | ||||||||
Peñasquito | 1,821 | 2,087 | 2,103 | 1,754 | 2,465 | 1,785 | 2,263 | 2,643 |
Antamina | 1,600 | 1,672 | 1,482 | 1,047 | 1,071 | 931 | 1,013 | 806 |
Constancia | 731 | 577 | 552 | 555 | 970 | 648 | 451 | 640 |
Blackwater | 148 | 136 | 138 | 35 | - | - | - | - |
Other | ||||||||
Los Filos 6 | - | - | - | 68 | 29 | 26 | 27 | 48 |
Zinkgruvan | 513 | 688 | 684 | 585 | 637 | 537 | 699 | 641 |
Neves-Corvo | 549 | 431 | 449 | 459 | 494 | 425 | 432 | 524 |
Aljustrel 7 | 516 | 180 | - | - | - | - | - | - |
Cozamin | 170 | 169 | 174 | 174 | 192 | 185 | 177 | 173 |
Marmato | 8 | 10 | 8 | 8 | 7 | 7 | 6 | 7 |
Mineral Park | 8 | - | - | - | - | - | - | - |
Total Other | 1,764 | 1,478 | 1,315 | 1,294 | 1,359 | 1,180 | 1,341 | 1,393 |
Total silver ounces produced | 6,064 | 5,950 | 5,590 | 4,685 | 5,865 | 4,544 | 5,068 | 5,482 |
Palladium ounces produced 2 | ||||||||
Stillwater 5 | 2,519 | 2,650 | 2,435 | 2,661 | 2,797 | 4,034 | 4,338 | 4,463 |
Cobalt pounds produced 2 | ||||||||
Voisey's Bay | 670 | 604 | 647 | 540 | 393 | 397 | 259 | 240 |
GEOs produced 8 | 205,037 | 172,697 | 161,630 | 150,500 | 189,059 | 142,787 | 145,151 | 158,490 |
Average payable rate 2 | ||||||||
Gold | 95.0 % | 94.6 % | 95.2 % | 94.9 % | 95.3 % | 95.0 % | 95.0 % | 94.7 % |
Silver | 86.9 % | 87.6 % | 87.7 % | 86.3 % | 84.6 % | 83.9 % | 84.4 % | 84.5 % |
Palladium | 96.9 % | 96.7 % | 97.4 % | 96.4 % | 97.5 % | 98.4 % | 97.3 % | 97.8 % |
Cobalt | 93.3 % | 93.3 % | 93.3 % | 93.3 % | 93.3 % | 93.3 % | 93.3 % | 93.3 % |
GEOs 9 | 92.2 % | 91.8 % | 92.2 % | 91.8 % | 91.4 % | 91.0 % | 90.7 % | 90.6 % |
1) | All figures in thousands except gold and palladium ounces produced. |
2) | Quantity produced represents the amount of gold, silver, palladium and cobalt contained in concentrate or doré prior to smelting or refining deductions. Production figures and payable rates are based on information provided by the operators of the mining operations to which the mineral stream interests relate or management estimates in those situations where other information is not available. Certain production figures and payable rates may be updated in future periods as additional information is received. |
3) | Comprised of the Coleman, Copper Cliff, Garson, Creighton, Stobie and Totten gold interests. |
4) | Under the terms of the San Dimas PMPA, the Company is entitled to an amount equal to 25% of the payable gold production plus an additional amount of gold equal to 25% of the payable silver production converted to gold at a fixed gold to silver exchange ratio of 70:1 from the San Dimas mine. If the average gold to silver price ratio decreases to less than 50:1 or increases to more than 90:1 for a period of 6 months or more, then the "70" shall be revised to "50" or "90", as the case may be, until such time as the average gold to silver price ratio is between 50:1 to 90:1 for a period of 6 months or more in which event the "70" shall be reinstated. From April 30, 2025 to October 28, 2025, the fixed gold to silver exchange ratio was revised to 90:1. Effective October 29, 2025, the fixed gold to silver exchange ratio was returned to 70:1. For reference, attributable silver production from prior periods is as follows: Q4 2025 - 329,000 ounces; Q3 2025 - 364,000 ounces; Q2 2025 - 311,000 ounces; Q1 2025 - 340,000 ounces; Q4 2024 - 295,000 ounces; Q3 2024 - 262,000 ounces; Q2 2024 - 285,000 ounces; Q1 2024 - 291,000 ounces. |
5) | Comprised of the Stillwater and East Boulder gold and palladium interests. On September 12, 2024, Sibanye Stillwater ("Sibanye") announced that as a result of low palladium prices it was placing the Stillwater West operations into care and maintenance, while using Stillwater East and East Boulder operations to improve efficiencies that could get Stillwater West back to production as prices permit. |
6) | On April 1, 2025, Equinox Gold Corp., reported it has indefinitely suspended operations at Los Filos following the expiry of its land access agreement with the community of Carrizalillo on March 31, 2025. |
7) | On September 12, 2023, it was announced that the production of the zinc and lead concentrates at the Aljustrel mine will be halted from September 24, 2023 until the third quarter of 2025. |
8) | GEOs, which are provided to assist the reader, are based on the following commodity price assumptions: $2,600 per ounce gold; $30.00 per ounce silver; $950 per ounce palladium; and $13.50 per pound cobalt; consistent with those used in estimating the Company's production guidance for 2025. |
Summary of Units Sold
Q4 2025 | Q3 2025 | Q2 2025 | Q1 2025 | Q4 2024 | Q3 2024 | Q2 2024 | Q1 2024 | |
Gold ounces sold | ||||||||
Salobo | 83,697 | 55,768 | 76,331 | 83,809 | 55,170 | 58,101 | 54,962 | 56,841 |
Sudbury 2 | 3,715 | 4,729 | 2,849 | 5,632 | 4,048 | 2,495 | 5,679 | 4,129 |
Constancia | 17,029 | 2,708 | 6,827 | 9,788 | 17,873 | 5,186 | 6,640 | 20,123 |
San Dimas | 8,686 | 6,655 | 7,235 | 8,962 | 6,990 | 7,022 | 6,801 | 7,933 |
Stillwater 3 | 1,790 | 1,465 | 1,386 | 1,947 | 2,410 | 1,635 | 2,628 | 2,355 |
Blackwater | 5,225 | 6,463 | 3,291 | 110 | - | - | - | - |
Other | ||||||||
Marmato | 809 | 749 | 742 | 737 | 650 | 550 | 616 | 638 |
Goose | 528 | 95 | - | - | - | - | - | - |
Santo Domingo 4 | 312 | 312 | 312 | 312 | 312 | 447 | - | - |
El Domo 4 | - | - | - | - | 209 | 258 | - | - |
Total Other | 1,649 | 1,156 | 1,054 | 1,049 | 1,171 | 1,255 | 616 | 638 |
Total gold ounces sold | 121,791 | 78,944 | 98,973 | 111,297 | 87,662 | 75,694 | 77,326 | 92,019 |
Silver ounces sold | ||||||||
Peñasquito | 1,878 | 1,609 | 2,112 | 1,976 | 1,852 | 1,667 | 1,482 | 1,839 |
Antamina | 1,893 | 1,552 | 1,073 | 884 | 858 | 989 | 917 | 762 |
Constancia | 613 | 275 | 625 | 730 | 797 | 366 | 422 | 726 |
Blackwater | 137 | 137 | 143 | - | - | - | - | - |
Other | ||||||||
Los Filos | - | 3 | 8 | 57 | 29 | 26 | 24 | 44 |
Zinkgruvan | 358 | 708 | 520 | 446 | 452 | 488 | 597 | 297 |
Neves-Corvo | 245 | 212 | 224 | 218 | 154 | 185 | 216 | 243 |
Aljustrel | 382 | 122 | - | - | - | - | - | 1 |
Cozamin | 169 | 133 | 154 | 164 | 158 | 148 | 158 | 147 |
Marmato | 10 | 9 | 9 | 8 | 7 | 6 | 7 | 8 |
Total Other | 1,164 | 1,187 | 915 | 893 | 800 | 853 | 1,002 | 740 |
Total silver ounces sold | 5,685 | 4,760 | 4,868 | 4,483 | 4,307 | 3,875 | 3,823 | 4,067 |
Palladium ounces sold | ||||||||
Stillwater 3 | 1,730 | 2,594 | 2,575 | 2,457 | 4,434 | 3,761 | 4,301 | 4,774 |
Cobalt pounds sold | ||||||||
Voisey's Bay | 485 | 529 | 353 | 265 | 485 | 88 | 88 | 309 |
GEOs sold 5 | 190,535 | 137,563 | 157,916 | 165,297 | 141,495 | 122,242 | 123,462 | 142,294 |
Cumulative payable units PBND 6 | ||||||||
Gold ounces | 108,890 | 106,222 | 90,284 | 100,512 | 123,511 | 97,929 | 90,406 | 88,145 |
Silver ounces | 3,227 | 3,629 | 3,178 | 3,145 | 3,583 | 2,931 | 2,993 | 2,539 |
Palladium ounces | 5,169 | 4,424 | 4,414 | 4,596 | 4,439 | 6,186 | 6,018 | 6,198 |
Cobalt pounds | 1,341 | 1,202 | 1,168 | 917 | 678 | 796 | 513 | 360 |
GEOs 5 | 154,981 | 155,949 | 134,630 | 143,238 | 169,994 | 138,141 | 129,808 | 121,574 |
1) | All figures in thousands except gold and palladium ounces sold. |
2) | Comprised of the Coleman, Copper Cliff, Garson, Creighton, Stobie and Totten gold interests. |
3) | Comprised of the Stillwater and East Boulder gold and palladium interests. |
4) | The ounces sold under Santo Domingo and El Domo relate to ounces received due to the delay ounce provision as per the respective PMPA. Please see the Company's MD&A for more information. |
5) | GEOs, which are provided to assist the reader, are based on the following commodity price assumptions: $2,600 per ounce gold; $30.00 per ounce silver; $950 per ounce palladium; and $13.50 per pound cobalt; consistent with those used in estimating the Company's production guidance for 2025. |
6) | Payable gold, silver and palladium ounces as well as cobalt pounds produced but not yet delivered ("PBND") are based on management estimates. These figures may be updated in future periods as additional information is received. |
Results of Operations
The operating results of the Company's reportable operating segments are summarized in the tables and commentary below.
Three Months Ended December 31, 2025 | ||||||||||||||||
Units Produced2 | Units Sold | Average Realized Price ($'s Per Unit) | Average Cash Cost ($'s Per Unit) 3 | Average Depletion ($'s Per Unit) 4 | Sales | Net Earnings | Cash Flow From Operations | Total Assets | ||||||||
Gold | ||||||||||||||||
Salobo | 88,907 | 83,697 | $ | 4,214 | $ | 429 | $ | 404 | $ | 352,713 | $ | 282,995 | $ | 316,820 | $ | 2,620,710 |
Sudbury 5 | 7,808 | 3,715 | 4,234 | 400 | 1,399 | 15,726 | 9,044 | 22,894 | 218,494 | |||||||
Constancia | 15,396 | 17,029 | 4,214 | 429 | 338 | 71,764 | 58,699 | 64,461 | 52,284 | |||||||
San Dimas | 8,206 | 8,686 | 4,214 | 643 | 428 | 36,603 | 27,296 | 31,015 | 125,218 | |||||||
Stillwater | 1,518 | 1,790 | 4,214 | 727 | 570 | 7,544 | 5,222 | 6,243 | 204,202 | |||||||
Blackwater | 5,479 | 5,225 | 4,234 | 1,485 | 606 | 22,123 | 11,197 | 28,991 | 331,048 | |||||||
Platreef | - | - | n.a. | n.a. | n.a. | - | - | - | 275,702 | |||||||
Other 6 | 3,362 | 1,649 | 4,184 | 598 | 1,406 | 6,901 | 3,596 | 5,915 | 1,457,132 | |||||||
130,676 | 121,791 | $ | 4,215 | $ | 495 | $ | 452 | $ | 513,374 | $ | 398,049 | $ | 476,339 | $ | 5,284,790 | |
Silver | ||||||||||||||||
Peñasquito | 1,821 | 1,878 | $ | 55.20 | $ | 4.56 | $ | 5.09 | $ | 103,647 | $ | 85,530 | $ | 95,086 | $ | 206,866 |
Antamina | 1,600 | 1,893 | 55.20 | 11.15 | 4.39 | 104,502 | 75,072 | 83,387 | 459,083 | |||||||
Constancia | 731 | 613 | 55.20 | 6.32 | 6.43 | 33,836 | 26,024 | 29,963 | 151,403 | |||||||
Blackwater | 148 | 137 | 61.49 | 10.88 | 7.52 | 8,446 | 5,918 | 9,013 | 167,502 | |||||||
Other 7 | 1,764 | 1,164 | 74.54 | 13.59 | 3.78 | 86,766 | 66,542 | 45,642 | 556,887 | |||||||
6,064 | 5,685 | $ | 59.32 | $ | 8.95 | $ | 4.79 | $ | 337,197 | $ | 259,086 | $ | 263,091 | $ | 1,541,741 | |
Palladium | ||||||||||||||||
Stillwater | 2,519 | 1,730 | $ | 1,479 | $ | 244 | $ | 492 | $ | 2,558 | $ | 1,285 | $ | 2,136 | $ | 208,892 |
Platreef | - | - | n.a. | n.a. | n.a. | - | - | - | 78,814 | |||||||
2,519 | 1,730 | $ | 1,479 | $ | 244 | $ | 492 | $ | 2,558 | $ | 1,285 | $ | 2,136 | $ | 287,706 | |
Platinum | ||||||||||||||||
Marathon | - | - | $ | n.a. | $ | n.a. | $ | n.a. | $ | - | $ | - | $ | - | $ | 9,451 |
Platreef | - | - | n.a. | n.a. | n.a. | - | - | - | 57,584 | |||||||
- | - | $ | n.a. | $ | n.a. | $ | n.a. | $ | - | $ | - | $ | - | $ | 67,035 | |
Cobalt | ||||||||||||||||
Voisey's Bay | 670 | 485 | $ | 23.89 | $ | 4.33 | $ | 9.02 | $ | 11,585 | $ | 5,110 | $ | 7,664 | $ | 215,877 |
Operating results | $ | 864,714 | $ | 663,530 | $ | 749,230 | $ | 7,397,149 | ||||||||
Other | ||||||||||||||||
General and administrative | $ | (11,796) | $ | (7,631) | ||||||||||||
Share based compensation | (1,709) | - | ||||||||||||||
Donations and community investments | (4,269) | (3,980) | ||||||||||||||
Finance costs | (1,451) | (1,114) | ||||||||||||||
Other | 6,373 | 9,813 | ||||||||||||||
Income tax | (92,428) | (41) | ||||||||||||||
Total other | $ | (105,280) | $ | (2,953) | $ | 1,728,632 | ||||||||||
$ | 558,250 | $ | 746,277 | $ | 9,125,781 | |||||||||||
1) | Units of gold, silver and palladium produced and sold are reported in ounces, while cobalt is reported in pounds. All figures in thousands except gold and palladium ounces produced and sold and per unit amounts. |
2) | Quantity produced represents the amount of gold, silver, palladium and cobalt contained in concentrate or doré prior to smelting or refining deductions. Production figures are based on information provided by the operators of the mining operations to which the mineral stream interests relate or management estimates in those situations where other information is not available. Certain production figures may be updated in future periods as additional information is received. |
3) | Refer to discussion on non-GAAP measure (iii) at the end of this press release. |
4) | Includes the non-cash per ounce cost of sale associated with delay ounces. Please see the Company's MD&A for more information. |
5) | Comprised of the operating Coleman, Copper Cliff, Garson, Creighton, Stobie and Totten gold interests and the non-operating Victor gold interest. |
6) | Other gold interests comprised of the operating Marmato, Goose and Hemlo gold interests as well as the non-operating Copper World, Santo Domingo, Fenix, El Domo, Marathon, Cangrejos, Curraghinalt, Kudz Ze Kayah, Koné and Kurmuk, Spring Valley gold interests. Other includes ounces sold that were received under the delay ounce provision of the Santo Domingo PMPA. Please see the Company's MD&A for more information. |
7) | Other silver interests comprised of the operating Los Filos, Zinkgruvan, Neves-Corvo, Aljustrel, Marmato and Cozamin silver interests as well as the non-operating Stratoni, El Alto (previously referred to as Pascua-Lama), Copper World, Navidad, El Domo, Mineral Park and Kudz Ze Kayah silver interests. |
Three Months Ended December 31, 2024 | ||||||||||||||||||
Units Produced2 | Units Sold | Average Realized Price ($'s Per Unit) | Average Cash Cost ($'s Per Unit) 3 | Average Depletion ($'s Per Unit) 4 | Sales | Impairment Charges | Net Earnings | Cash Flow From Operations | Total Assets | |||||||||
Gold | ||||||||||||||||||
Salobo | 84,291 | 55,170 | $ | 2,676 | $ | 425 | $ | 378 | $ | 147,610 | $ | - | $ | 103,323 | $ | 121,254 | $ | 2,595,485 |
Sudbury 5 | 5,259 | 4,048 | 2,709 | 400 | 1,326 | 10,968 | - | 3,982 | 9,853 | 241,551 | ||||||||
Constancia | 18,727 | 17,873 | 2,676 | 425 | 323 | 47,821 | - | 34,463 | 40,232 | 64,326 | ||||||||
San Dimas | 7,263 | 6,990 | 2,676 | 637 | 290 | 18,704 | - | 12,226 | 14,251 | 136,481 | ||||||||
Stillwater | 2,166 | 2,410 | 2,676 | 481 | 421 | 6,448 | - | 4,275 | 5,289 | 207,460 | ||||||||
Blackwater | - | - | n.a. | n.a. | n.a. | - | - | - | - | 340,231 | ||||||||
Platreef | - | - | n.a. | n.a. | n.a. | - | - | - | - | 275,702 | ||||||||
Other 6 | 622 | 1,171 | 2,681 | 265 | 1,485 | 3,139 | - | 1,089 | 2,828 | 365,383 | ||||||||
118,328 | 87,662 | $ | 2,677 | $ | 440 | $ | 420 | $ | 234,690 | $ | - | $ | 159,358 | $ | 193,707 | $ | 4,226,619 | |
Silver | ||||||||||||||||||
Peñasquito | 2,465 | 1,852 | $ | 31.48 | $ | 4.50 | $ | 4.86 | $ | 58,293 | $ | - | $ | 40,965 | $ | 49,960 | $ | 244,465 |
Antamina | 1,071 | 858 | 31.48 | 6.28 | 8.46 | 27,009 | - | 14,360 | 21,619 | 490,771 | ||||||||
Constancia | 970 | 797 | 31.48 | 6.26 | 6.10 | 25,084 | - | 15,232 | 20,096 | 165,378 | ||||||||
Blackwater | - | - | n.a. | n.a. | n.a. | - | - | - | - | 140,908 | ||||||||
Other 7 | 1,359 | 800 | 30.43 | 4.37 | 5.34 | 24,347 | - | 16,570 | 25,204 | 521,722 | ||||||||
5,865 | 4,307 | $ | 31.28 | $ | 5.16 | $ | 5.90 | $ | 134,733 | $ | - | $ | 87,127 | $ | 116,879 | $ | 1,563,244 | |
Palladium | ||||||||||||||||||
Stillwater | 2,797 | 4,434 | $ | 1,008 | $ | 184 | $ | 429 | $ | 4,468 | $ | - | $ | 1,749 | $ | 3,653 | $ | 213,179 |
Platreef | - | - | n.a. | n.a. | n.a. | - | - | - | - | 78,814 | ||||||||
2,797 | 4,434 | $ | 1,008 | $ | 184 | $ | 429 | $ | 4,468 | $ | - | $ | 1,749 | $ | 3,653 | $ | 291,993 | |
Platinum | ||||||||||||||||||
Marathon | - | - | $ | n.a. | $ | n.a. | $ | n.a. | $ | - | $ | - | $ | - | $ | - | $ | 9,451 |
Platreef | - | - | n.a. | n.a. | n.a. | - | - | - | - | 57,584 | ||||||||
- | - | $ | n.a. | $ | n.a. | $ | n.a. | $ | - | $ | - | $ | - | $ | - | $ | 67,035 | |
Cobalt | ||||||||||||||||||
Voisey's Bay | 393 | 485 | $ | 13.66 | $ | 2.59 | $ | 12.78 | $ | 6,625 | $ | (108,861) | $ | (109,688) | $ | 4,618 | $ | 230,689 |
Operating results | $ | 380,516 | $ | (108,861) | $ | 138,546 | $ | 318,857 | $ | 6,379,580 | ||||||||
Other | ||||||||||||||||||
General and administrative | $ | (10,475) | $ | (6,996) | ||||||||||||||
Share based compensation | (6,118) | - | ||||||||||||||||
Donations and community investments | (4,332) | (3,913) | ||||||||||||||||
Finance costs | (1,404) | (1,046) | ||||||||||||||||
Other | 9,138 | 6,787 | ||||||||||||||||
Income tax | (37,207) | 5,782 | ||||||||||||||||
Total other | $ | (50,398) | $ | 614 | $ | 1,044,877 | ||||||||||||
$ | 88,148 | $ | 319,471 | $ | 7,424,457 | |||||||||||||
1) | Units of gold, silver and palladium produced and sold are reported in ounces, while cobalt is reported in pounds. All figures in thousands except gold and palladium ounces produced and sold and per unit amounts. |
2) | Quantity produced represents the amount of gold, silver, palladium and cobalt contained in concentrate or doré prior to smelting or refining deductions. Production figures are based on information provided by the operators of the mining operations to which the mineral stream interests relate or management estimates in those situations where other information is not available. Certain production figures may be updated in future periods as additional information is received. |
3) | Refer to discussion on non-GAAP measure (iii) at the end of this press release. |
4) | Includes the non-cash per ounce cost of sale associated with delay ounces. Please see the Company's MD&A for more information. |
5) | Comprised of the operating Coleman, Copper Cliff, Garson, Creighton and Totten gold interests as well as the non-operating Stobie and Victor gold interests. |
6) | Other gold interests are comprised of the operating Marmato gold interest as well as the non-operating Minto, Copper World, Santo Domingo, Fenix, El Domo, Marathon, Goose, Cangrejos, Curraghinalt and Kudz Ze Kayah gold interests. Other includes ounces sold that were received under the delay ounce provision of the Santo Domingo and El Domo PMPAs (see footnote 3 on page 9 of this MD&A for more information). |
7) | Other silver interests comprised of the operating Los Filos, Zinkgruvan, Neves-Corvo, Marmato and Cozamin silver interests as well as the non-operating Stratoni, Aljustrel, Minto, El Alto (previously referred to as Pascua-Lama), Copper World, Navidad, El Domo, Mineral Park and Kudz Ze Kayah silver interests. |
Comparative Results of Operations on a GEO Basis
Q4 2025 | Q4 2024 | Change | Change | ||||||||
GEO Production 1, 2 | 205,037 | 189,059 | 15,978 | 8.5 % | |||||||
GEO Sales 2 | 190,535 | 141,495 | 49,040 | 34.7 % | |||||||
Average price per GEO sold 2 | $ | 4,538 | $ | 2,689 | $ | 1,849 | 68.8 % | ||||
Revenue | $ | 864,714 | $ | 380,516 | $ | 484,198 | 127.2 % | ||||
Cost of sales, excluding depletion | $ | 114,956 | $ | 64,236 | $ | (50,720) | (79.0) % | ||||
Depletion | 86,228 | 68,873 | (17,355) | (25.2) % | |||||||
Cost of sales | $ | 201,184 | $ | 133,109 | $ | (68,075) | (51.1) % | ||||
Gross margin | $ | 663,530 | $ | 247,407 | $ | 416,123 | 168.2 % | ||||
General and administrative | 11,796 | 10,475 | (1,321) | (12.6) % | |||||||
Share based compensation | 1,709 | 6,118 | 4,409 | 72.1 % | |||||||
Donations and community investments | 4,269 | 4,332 | 63 | 1.5 % | |||||||
Impairment of mineral stream interests | - | 108,861 | 108,861 | 100.0 % | |||||||
Earnings from operations | $ | 645,756 | $ | 117,621 | $ | 528,135 | 449.0 % | ||||
Other income (expense) | 6,373 | 9,138 | (2,765) | (30.3) % | |||||||
Earnings before finance costs and income taxes | $ | 652,129 | $ | 126,759 | $ | 525,370 | 414.5 % | ||||
Finance costs | 1,451 | 1,404 | (47) | (3.3) % | |||||||
Earnings before income taxes | $ | 650,678 | $ | 125,355 | $ | 525,323 | 419.1 % | ||||
Income tax expense | 92,428 | 37,207 | (55,221) | (148.4) % | |||||||
Net earnings | $ | 558,250 | $ | 88,148 | $ | 470,102 | 533.3 % |
1) | Quantity produced represents the amount of gold, silver, palladium and cobalt contained in concentrate or doré prior to smelting or refining deductions. Production figures are based on information provided by the operators of the mining operations to which the mineral stream interests relate or management estimates in those situations where other information is not available. Certain production figures may be updated in future periods as additional information is received. |
2) | GEOs, which are provided to assist the reader, are based on the following commodity price assumptions: $2,600 per ounce gold; $30.00 per ounce silver; $950 per ounce palladium; and $13.50 per pound cobalt; consistent with those used in estimating the Company's production guidance for 2025. |
Year Ended December 31, 2025 | ||||||||||||||||||
Units Produced2 | Units Sold | Average Realized Price ($'s Per Unit) | Average Cash Cost ($'s Per Unit) 3 | Average Depletion ($'s Per Unit) 4 | Sales | Gain on Disposal 5 | Net Earnings | Cash Flow From Operations | Total Assets | |||||||||
Gold | ||||||||||||||||||
Salobo | 296,706 | 299,605 | $ | 3,471 | $ | 429 | $ | 396 | $ | 1,039,878 | $ | - | $ | 792,618 | $ | 911,393 | $ | 2,620,710 |
Sudbury 6 | 22,943 | 16,925 | 3,444 | 400 | 1,362 | 58,290 | - | 28,463 | 51,506 | 218,494 | ||||||||
Constancia | 37,673 | 36,352 | 3,629 | 427 | 331 | 131,904 | - | 104,347 | 116,389 | 52,284 | ||||||||
San Dimas | 31,116 | 31,538 | 3,469 | 641 | 357 | 109,411 | - | 77,939 | 89,202 | 125,218 | ||||||||
Stillwater | 6,228 | 6,588 | 3,463 | 605 | 495 | 22,811 | - | 15,567 | 18,825 | 204,202 | ||||||||
Blackwater | 15,425 | 15,089 | 3,748 | 1,307 | 609 | 56,549 | - | 27,651 | 40,543 | 331,048 | ||||||||
Platreef | - | - | n.a. | n.a. | n.a. | - | - | - | - | 275,702 | ||||||||
Other 7 | 6,080 | 4,908 | 3,540 | 473 | 1,335 | 17,375 | 85,724 | 94,227 | 15,054 | 1,457,132 | ||||||||
416,171 | 411,005 | $ | 3,494 | $ | 479 | $ | 448 | $ | 1,436,218 | $ | 85,724 | $ | 1,140,812 | $ | 1,242,912 | $ | 5,284,790 | |
Silver | ||||||||||||||||||
Peñasquito | 7,765 | 7,575 | $ | 39.82 | $ | 4.56 | $ | 4.96 | $ | 301,590 | $ | - | $ | 229,453 | $ | 267,052 | $ | 206,866 |
Antamina | 5,801 | 5,402 | 42.59 | 8.65 | 5.87 | 230,098 | - | 151,672 | 183,359 | 459,083 | ||||||||
Constancia | 2,415 | 2,243 | 39.76 | 6.28 | 6.23 | 89,156 | - | 61,095 | 75,070 | 151,403 | ||||||||
Blackwater | 457 | 417 | 46.50 | 8.27 | 8.27 | 19,378 | - | 12,486 | 16,561 | 167,502 | ||||||||
Other 8 | 5,851 | 4,159 | 47.21 | 7.55 | 4.36 | 196,449 | - | 146,898 | 130,717 | 556,887 | ||||||||
22,289 | 19,796 | $ | 42.26 | $ | 6.58 | $ | 5.30 | $ | 836,671 | $ | - | $ | 601,604 | $ | 672,759 | $ | 1,541,741 | |
Palladium | ||||||||||||||||||
Stillwater | 10,265 | 9,356 | $ | 1,126 | $ | 195 | $ | 458 | $ | 10,536 | $ | - | $ | 4,422 | $ | 8,709 | $ | 208,892 |
Platreef | - | - | n.a. | n.a. | n.a. | - | - | - | - | 78,814 | ||||||||
10,265 | 9,356 | $ | 1,126 | $ | 195 | $ | 458 | $ | 10,536 | $ | - | $ | 4,422 | $ | 8,709 | $ | 287,706 | |
Platinum | ||||||||||||||||||
Marathon | - | - | $ | n.a. | $ | n.a. | $ | n.a. | $ | - | $ | - | $ | - | $ | - | $ | 9,451 |
Platreef | - | - | n.a. | n.a. | n.a. | - | - | - | - | 57,584 | ||||||||
- | - | $ | n.a. | $ | n.a. | $ | n.a. | $ | - | $ | - | $ | - | $ | - | $ | 67,035 | |
Cobalt | ||||||||||||||||||
Voisey's Bay | 2,460 | 1,632 | $ | 19.11 | $ | 3.57 | $ | 9.08 | $ | 31,175 | $ | - | $ | 10,534 | $ | 23,079 | $ | 215,877 |
Operating results | $ | 2,314,600 | $ | 85,724 | $ | 1,757,372 | $ | 1,947,459 | $ | 7,397,149 | ||||||||
Other | ||||||||||||||||||
General and administrative | $ | (46,767) | $ | (44,227) | ||||||||||||||
Share based compensation | (32,504) | (17,209) | ||||||||||||||||
Donations and community investments | (10,736) | (10,396) | ||||||||||||||||
Finance costs | (5,760) | (4,444) | ||||||||||||||||
Other | 36,463 | 37,443 | ||||||||||||||||
Income tax | (226,348) | (3,645) | ||||||||||||||||
Total other | $ | (285,652) | $ | (42,478) | $ | 1,728,632 | ||||||||||||
$ | 1,471,720 | $ | 1,904,981 | $ | 9,125,781 | |||||||||||||
1) | Units of gold, silver and palladium produced and sold are reported in ounces, while cobalt is reported in pounds. All figures in thousands except gold and palladium ounces produced and sold and per unit amounts. |
2) | Quantity produced represents the amount of gold, silver, palladium and cobalt contained in concentrate or doré prior to smelting or refining deductions. Production figures are based on information provided by the operators of the mining operations to which the mineral stream interests relate or management estimates in those situations where other information is not available. Certain production figures may be updated in future periods as additional information is received. |
3) | Refer to discussion on non-GAAP measure (iii) at the end of this press release. |
4) | Includes the non-cash per ounce cost of sale associated with delay ounces. Please see the Company's MD&A for more information. |
5) | The gain on disposal of Other gold interests relates to the gain on the buyback of 33% of the Cangrejos PMPA. |
6) | Comprised of the operating Coleman, Copper Cliff, Garson, Creighton, Stobie and Totten gold interests and the non-operating Victor gold interest. |
7) | Other gold interests comprised of the operating Marmato, Goose and Hemlo gold interests as well as the non-operating Copper World, Santo Domingo, Fenix, El Domo, Marathon, Cangrejos, Curraghinalt, Kudz Ze Kayah, Koné and Kurmuk, Spring Valley gold interests. Other includes ounces sold that were received under the delay ounce provision of the Santo Domingo PMPA. Please see the Company's MD&A for more information. |
8) | Other silver interests comprised of the operating Los Filos, Zinkgruvan, Neves-Corvo, Aljustrel, Marmato and Cozamin silver interests as well as the non-operating Stratoni, El Alto (previously referred to as Pascua-Lama), Copper World, Navidad, El Domo, Mineral Park and Kudz Ze Kayah silver interests. |
Year Ended December 31, 2024 | ||||||||||||||||||||||
UnitsProduced2 | Units Sold | AverageRealizedPrice ($'s Per Unit) | AverageCash Cost($'s PerUnit) 3 | AverageDepletion($'s PerUnit) 4 | Sales | ImpairmentCharges | Net Earnings | Cash FlowFrom Operations | Total Assets | |||||||||||||
Gold | ||||||||||||||||||||||
Salobo | 271,827 | 225,074 | $ | 2,397 | $ | 425 | $ | 382 | $ | 539,583 | $ | - | $ | 358,081 | $ | 444,015 | $ | 2,595,485 | ||||
Sudbury 5 | 18,947 | 16,351 | 2,391 | 400 | 1,280 | 39,098 | - | 11,623 | 32,571 | 241,551 | ||||||||||||
Constancia | 50,072 | 49,822 | 2,370 | 422 | 320 | 118,096 | - | 81,126 | 97,066 | 64,326 | ||||||||||||
San Dimas | 28,776 | 28,746 | 2,388 | 635 | 287 | 68,654 | - | 42,166 | 50,407 | 136,481 | ||||||||||||
Stillwater | 9,149 | 9,028 | 2,392 | 425 | 444 | 21,592 | - | 13,743 | 17,752 | 207,460 | ||||||||||||
Blackwater | - | - | n.a. | n.a. | n.a. | - | - | - | - | 340,231 | ||||||||||||
Platreef | - | - | n.a. | n.a. | n.a. | - | - | - | - | 275,702 | ||||||||||||
Other 6 | 2,477 | 3,680 | 2,453 | 284 | 1,192 | 9,028 | - | 3,596 | 7,982 | 365,383 | ||||||||||||
381,248 | 332,701 | $ | 2,393 | $ | 440 | $ | 419 | $ | 796,051 | $ | - | $ | 510,335 | $ | 649,793 | $ | 4,226,619 | |||||
Silver | ||||||||||||||||||||||
Peñasquito | 9,156 | 6,840 | $ | 28.34 | $ | 4.50 | $ | 4.64 | $ | 193,871 | $ | - | $ | 131,325 | $ | 163,092 | $ | 244,465 | ||||
Antamina | 3,821 | 3,526 | 28.56 | 5.74 | 8.16 | 100,719 | - | 51,738 | 80,497 | 490,771 | ||||||||||||
Constancia | 2,709 | 2,311 | 28.25 | 6.23 | 6.15 | 65,264 | - | 36,676 | 50,881 | 165,378 | ||||||||||||
Blackwater | - | - | n.a. | n.a. | n.a. | - | - | - | - | 140,908 | ||||||||||||
Other 7 | 5,273 | 3,395 | 28.85 | 4.31 | 4.71 | 97,976 | - | 67,356 | 85,230 | 521,722 | ||||||||||||
20,959 | 16,072 | $ | 28.49 | $ | 4.98 | $ | 5.64 | $ | 457,830 | $ | - | $ | 287,095 | $ | 379,700 | $ | 1,563,244 | |||||
Palladium | ||||||||||||||||||||||
Stillwater | 15,632 | 17,270 | $ | 984 | $ | 179 | $ | 434 | $ | 16,999 | $ | - | $ | 6,423 | $ | 13,911 | $ | 213,179 | ||||
Platreef | - | - | n.a. | n.a. | n.a. | - | - | - | - | 78,814 | ||||||||||||
15,632 | 17,270 | $ | 984 | $ | 179 | $ | 434 | $ | 16,999 | $ | - | $ | 6,423 | $ | 13,911 | $ | 291,993 | |||||
Platinum | ||||||||||||||||||||||
Marathon | - | - | $ | n.a. | $ | n.a. | $ | n.a. | $ | - | $ | - | $ | - | $ | - | $ | 9,451 | ||||
Platreef | - | - | n.a. | n.a. | n.a. | - | - | - | - | 57,584 | ||||||||||||
- | - | $ | n.a. | $ | n.a. | $ | n.a. | $ | - | $ | - | $ | - | $ | - | $ | 67,035 | |||||
Cobalt | ||||||||||||||||||||||
Voisey's Bay | 1,289 | 970 | $ | 14.18 | $ | 2.71 | $ | 12.78 | $ | 13,759 | $ | (108,861) | $ | (110,127) | $ | 14,025 | $ | 230,689 | ||||
Operating results | $ | 1,284,639 | $ | (108,861) | $ | 693,726 | $ | 1,057,429 | $ | 6,379,580 | ||||||||||||
Other | ||||||||||||||||||||||
General and administrative | $ | (40,668) | $ | (38,130) | ||||||||||||||||||
Share based compensation | (23,268) | (11,129) | ||||||||||||||||||||
Donations and community investments | (8,958) | (8,098) | ||||||||||||||||||||
Finance costs | (5,549) | (4,280) | ||||||||||||||||||||
Other | 29,061 | 23,273 | ||||||||||||||||||||
Income tax | (115,204) | 8,516 | ||||||||||||||||||||
Total other | $ | (164,586) | $ | (29,848) | $ | 1,044,877 | ||||||||||||||||
$ | 529,140 | $ | 1,027,581 | $ | 7,424,457 | |||||||||||||||||
1) | Units of gold, silver and palladium produced and sold are reported in ounces, while cobalt is reported in pounds. All figures in thousands except gold and palladium ounces produced and sold and per unit amounts. |
2) | Quantity produced represents the amount of gold, silver, palladium and cobalt contained in concentrate or doré prior to smelting or refining deductions. Production figures are based on information provided by the operators of the mining operations to which the mineral stream interests relate or management estimates in those situations where other information is not available. Certain production figures may be updated in future periods as additional information is received. |
3) | Refer to discussion on non-GAAP measure (iii) at the end of this press release. |
4) | Includes the non-cash per ounce cost of sale associated with delay ounces. Please see the Company's MD&A for more information. |
5) | Comprised of the operating Coleman, Copper Cliff, Garson, Creighton and Totten gold interests as well as the non-operating Stobie and Victor gold interests. |
6) | Other gold interests are comprised of the operating Marmato gold interest as well as the non-operating Minto, Copper World, Santo Domingo, Fenix, El Domo, Marathon, Goose, Cangrejos, Curraghinalt and Kudz Ze Kayah gold interests. Other includes ounces sold that were received under the delay ounce provision of the Santo Domingo and El Domo PMPAs (see footnote 3 on page 9 of this MD&A for more information). |
7) | Other silver interests comprised of the operating Los Filos, Zinkgruvan, Neves-Corvo, Marmato and Cozamin silver interests as well as the non-operating Stratoni, Aljustrel, Minto, El Alto (previously referred to as Pascua-Lama), Copper World, Navidad, El Domo, Mineral Park and Kudz Ze Kayah silver interests. |
Comparative Results of Operations on a GEO Basis
2025 | 2024 | Change | Change | ||||||||
GEO Production 1, 2 | 689,864 | 635,488 | 54,377 | 8.6 % | |||||||
GEO Sales 2 | 651,311 | 529,493 | 121,818 | 23.0 % | |||||||
Average price per GEO sold 2 | $ | 3,554 | $ | 2,426 | $ | 1,128 | 46.5 % | ||||
Revenue | $ | 2,314,600 | $ | 1,284,639 | $ | 1,029,961 | 80.2 % | ||||
Cost of sales, excluding depletion | $ | 339,063 | $ | 235,108 | $ | (103,955) | (44.2) % | ||||
Depletion | 303,889 | 246,944 | (56,945) | (23.1) % | |||||||
Cost of sales | $ | 642,952 | $ | 482,052 | $ | (160,900) | (33.4) % | ||||
Gross margin | $ | 1,671,648 | $ | 802,587 | $ | 869,061 | 108.3 % | ||||
General and administrative | 46,767 | 40,668 | (6,099) | (15.0) % | |||||||
Share based compensation | 32,504 | 23,268 | (9,236) | (39.7) % | |||||||
Donations and community investments | 10,736 | 8,958 | (1,778) | (19.8) % | |||||||
Impairment of mineral stream interests | - | 108,861 | 108,861 | 100.0 % | |||||||
Earnings from operations | $ | 1,581,641 | $ | 620,832 | $ | 960,809 | 154.8 % | ||||
Gain on disposal of mineral stream interests | 85,724 | - | 85,724 | n.a. | |||||||
Other income (expense) | 36,463 | 29,061 | 7,402 | 25.5 % | |||||||
Earnings before finance costs and income taxes | $ | 1,703,828 | $ | 649,893 | $ | 1,053,935 | 162.2 % | ||||
Finance costs | 5,760 | 5,549 | (211) | (3.8) % | |||||||
Earnings before income taxes | $ | 1,698,068 | $ | 644,344 | $ | 1,053,724 | 163.5 % | ||||
Income tax expense | 226,348 | 115,204 | (111,144) | (96.5) % | |||||||
Net earnings | $ | 1,471,720 | $ | 529,140 | $ | 942,580 | 178.1 % |
1) | Quantity produced represents the amount of gold, silver, palladium and cobalt contained in concentrate or doré prior to smelting or refining deductions. Production figures are based on information provided by the operators of the mining operations to which the mineral stream interests relate or management estimates in those situations where other information is not available. Certain production figures may be updated in future periods as additional information is received. |
2) | GEOs, which are provided to assist the reader, are based on the following commodity price assumptions: $2,600 per ounce gold; $30.00 per ounce silver; $950 per ounce palladium; and $13.50 per pound cobalt; consistent with those used in estimating the Company's production guidance for 2025. |
Non-GAAP Measures
Wheaton has included, throughout this document, certain non-GAAP performance measures, including (i) adjusted net earnings and adjusted net earnings per share; (ii) operating cash flow per share (basic and diluted); (iii) average cash costs of gold, silver and palladium on a per ounce basis and cobalt on a per pound basis; and (iv) cash operating margin.
i. | Adjusted net earnings and adjusted net earnings per share are calculated by removing the effects of non-cash impairment charges (reversals) (if any), non-cash fair value (gains) losses and other one-time (income) expenses as well as the reversal of non-cash income tax expense (recovery) which is offset by income tax expense (recovery) recognized in the Statements of Shareholders' Equity and OCI, respectively. The Company believes that, in addition to conventional measures prepared in accordance with IFRS Accounting Standards, management and certain investors use this information to evaluate the Company's performance. |
The following table provides a reconciliation of adjusted net earnings and adjusted net earnings per share (basic and diluted).
Three Months EndedDecember 31 | Years EndedDecember 31 | |||||||||||
(in thousands, except for per share amounts) | 2025 | 2024 | 2025 | 2024 | ||||||||
Net earnings | $ | 558,250 | $ | 88,148 | $ | 1,471,720 | $ | 529,140 | ||||
Add back (deduct): | ||||||||||||
Impairment charge (reversal) | - | 108,861 | - | 108,861 | ||||||||
Gain on disposal of Mineral Stream Interest | - | - | (85,724) | - | ||||||||
Income tax expense related to disposal of Mineral Stream Interest | - | - | 12,859 | - | ||||||||
(Gain) loss on fair value adjustment of share purchase warrants held | (1,283) | 910 | (5,805) | 8 | ||||||||
Income tax (expense) recovery recognized in the Statement of Shareholders' Equity | - | - | (1,152) | - | ||||||||
Deferred income tax (expense) recovery recognized in the Statement of OCI | (1,799) | 1,225 | (18,286) | 2,857 | ||||||||
Other | (189) | (175) | (750) | (696) | ||||||||
Adjusted net earnings | $ | 554,979 | $ | 198,969 | $ | 1,372,862 | $ | 640,170 | ||||
Divided by: | ||||||||||||
Basic weighted average number of shares outstanding | 454,020 | 453,669 | 453,893 | 453,460 | ||||||||
Diluted weighted average number of shares outstanding | 454,841 | 454,361 | 454,685 | 454,119 | ||||||||
Equals: | ||||||||||||
Adjusted earnings per share - basic | $ | 1.222 | $ | 0.439 | $ | 3.025 | $ | 1.412 | ||||
Adjusted earnings per share - diluted | $ | 1.220 | $ | 0.438 | $ | 3.019 | $ | 1.410 | ||||
ii. | Operating cash flow per share (basic and diluted) is calculated by dividing cash generated by operating activities by the weighted average number of shares outstanding (basic and diluted). The Company presents operating cash flow per share as management and certain investors use this information to evaluate the Company's performance in comparison to other companies in the precious metal mining industry who present results on a similar basis. |
The following table provides a reconciliation of operating cash flow per share (basic and diluted).
Three Months EndedDecember 31 | Years EndedDecember 31 | |||||||||||
(in thousands, except for per share amounts) | 2025 | 2024 | 2025 | 2024 | ||||||||
Cash generated by operating activities | $ | 746,277 | $ | 319,471 | $ | 1,904,981 | $ | 1,027,581 | ||||
Divided by: | ||||||||||||
Basic weighted average number of shares outstanding | 454,020 | 453,669 | 453,893 | 453,460 | ||||||||
Diluted weighted average number of shares outstanding | 454,841 | 454,361 | 454,685 | 454,119 | ||||||||
Equals: | ||||||||||||
Operating cash flow per share - basic | $ | 1.644 | $ | 0.704 | $ | 4.197 | $ | 2.266 | ||||
Operating cash flow per share - diluted | $ | 1.641 | $ | 0.703 | $ | 4.190 | $ | 2.263 | ||||
iii. | Average cash cost of gold, silver and palladium on a per ounce basis and cobalt on a per pound basis is calculated by dividing the total cost of sales, less depletion and cost of sales related to delay ounces, by the ounces or pounds sold. In the precious metal mining industry, this is a common performance measure but does not have any standardized meaning prescribed by IFRS Accounting Standards. In addition to conventional measures prepared in accordance with IFRS Accounting Standards, management and certain investors use this information to evaluate the Company's performance and ability to generate cash flow. |
The following table provides a calculation of average cash cost of gold, silver and palladium on a per ounce basis and cobalt on a per pound basis.
Three Months EndedDecember 31 | Years EndedDecember 31 | |||||||||||
(in thousands, except for gold and palladium ounces sold and per unit amounts) | 2025 | 2024 | 2025 | 2024 | ||||||||
Cost of sales | $ | 201,184 | $ | 133,109 | $ | 642,952 | $ | 482,052 | ||||
Less: depletion | (86,228) | (68,873) | (303,889) | (246,944) | ||||||||
Less: cost of sales related to delay ounces 1 | (1,253) | (1,396) | (4,196) | (3,095) | ||||||||
Cash cost of sales | $ | 113,703 | $ | 62,840 | $ | 334,867 | $ | 232,013 | ||||
Cash cost of sales is comprised of: | ||||||||||||
Total cash cost of gold sold | $ | 60,314 | $ | 38,556 | $ | 197,001 | $ | 146,271 | ||||
Total cash cost of silver sold | 50,865 | 22,213 | 130,210 | 80,022 | ||||||||
Total cash cost of palladium sold | 422 | 816 | 1,827 | 3,088 | ||||||||
Total cash cost of cobalt sold 2 | 2,102 | 1,255 | 5,829 | 2,632 | ||||||||
Total cash cost of sales | $ | 113,703 | $ | 62,840 | $ | 334,867 | $ | 232,013 | ||||
Divided by: | ||||||||||||
Total gold ounces sold | 121,791 | 87,662 | 411,005 | 332,701 | ||||||||
Total silver ounces sold | 5,685 | 4,307 | 19,796 | 16,072 | ||||||||
Total palladium ounces sold | 1,730 | 4,434 | 9,356 | 17,270 | ||||||||
Total cobalt pounds sold | 485 | 485 | 1,632 | 970 | ||||||||
Equals: | ||||||||||||
Average cash cost of gold (per ounce) | $ | 495 | $ | 440 | $ | 479 | $ | 440 | ||||
Average cash cost of silver (per ounce) | $ | 8.95 | $ | 5.16 | $ | 6.58 | $ | 4.98 | ||||
Average cash cost of palladium (per ounce) | $ | 244 | $ | 184 | $ | 195 | $ | 179 | ||||
Average cash cost of cobalt (per pound) | $ | 4.33 | $ | 2.59 | $ | 3.57 | $ | 2.71 | ||||
1) | The cost of sales related to delay ounces is a non-cash expense. Please see the Company's MD&A for more information. |
iv. | Cash operating margin is calculated by adding back depletion and the cost of sales related to delay ounces to the gross margin. Cash operating margin on a per ounce or per pound basis is calculated by dividing the cash operating margin by the number of ounces or pounds sold during the period. The Company presents cash operating margin as management and certain investors use this information to evaluate the Company's performance in comparison to other companies in the precious metal mining industry who present results on a similar basis as well as to evaluate the Company's ability to generate cash flow. |
The following table provides a reconciliation of cash operating margin.
Three Months EndedDecember 31 | Years EndedDecember 31 | |||||||||||
(in thousands, except for gold and palladium ounces sold and per unit amounts) | 2025 | 2024 | 2025 | 2024 | ||||||||
Gross margin | $ | 663,530 | $ | 247,407 | $ | 1,671,648 | $ | 802,587 | ||||
Add back: depletion | 86,228 | 68,873 | 303,889 | 246,944 | ||||||||
Add back: cost of sales related to delay ounces 1 | 1,253 | 1,396 | 4,196 | 3,095 | ||||||||
Cash operating margin | $ | 751,011 | $ | 317,676 | $ | 1,979,733 | $ | 1,052,626 | ||||
Cash operating margin is comprised of: | ||||||||||||
Total cash operating margin of gold sold | $ | 453,060 | $ | 196,134 | $ | 1,239,217 | $ | 649,780 | ||||
Total cash operating margin of silver sold | 286,332 | 112,520 | 706,461 | 377,808 | ||||||||
Total cash operating margin of palladium sold | 2,136 | 3,652 | 8,709 | 13,911 | ||||||||
Total cash operating margin of cobalt sold | 9,483 | 5,370 | 25,346 | 11,127 | ||||||||
Total cash operating margin | $ | 751,011 | $ | 317,676 | $ | 1,979,733 | $ | 1,052,626 | ||||
Divided by: | ||||||||||||
Total gold ounces sold | 121,791 | 87,662 | 411,005 | 332,701 | ||||||||
Total silver ounces sold | 5,685 | 4,307 | 19,796 | 16,072 | ||||||||
Total palladium ounces sold | 1,730 | 4,434 | 9,356 | 17,270 | ||||||||
Total cobalt pounds sold | 485 | 485 | 1,632 | 970 | ||||||||
Equals: | ||||||||||||
Cash operating margin per gold ounce sold | $ | 3,720 | $ | 2,237 | $ | 3,015 | $ | 1,953 | ||||
Cash operating margin per silver ounce sold | $ | 50.37 | $ | 26.11 | $ | 35.70 | $ | 23.51 | ||||
Cash operating margin per palladium ounce sold | $ | 1,235 | $ | 824 | $ | 931 | $ | 806 | ||||
Cash operating margin per cobalt pound sold | $ | 19.55 | $ | 11.06 | $ | 15.54 | $ | 11.47 | ||||
1) | The cost of sales related to delay ounces is a non-cash expense. Please see the Company's MD&A for more information. |
These non-GAAP measures do not have any standardized meaning prescribed by IFRS Accounting Standards, and other companies may calculate these measures differently. The presentation of these non-GAAP measures is intended to provide additional information and should not be considered in isolation or as a substitute for measures of performance prepared in accordance with IFRS Accounting Standards. For more detailed information, please refer to Wheaton's MD&A available on the Company's website at www.wheatonpm.com and posted on SEDAR+ at www.sedarplus.ca.
CAUTIONARY NOTE REGARDING FORWARD-LOOKING STATEMENTS
This press release contains "forward-looking statements" within the meaning of the United States Private Securities Litigation Reform Act of 1995 and "forward-looking information" within the meaning of applicable Canadian securities legislation concerning the business, operations and financial performance of Wheaton and, in some instances, the business, mining operations and performance of Wheaton's Precious Metals Purchase Agreement ("PMPA") counterparties. Forward-looking statements, which are all statements other than statements of historical fact, include, but are not limited to, statements with respect to:
Generally, these forward-looking statements can be identified by the use of forward-looking terminology such as "plans", "expects" or "does not expect", "is expected", "budget", "scheduled", "estimates", "forecasts", "projects", "intends", "anticipates" or "does not anticipate", or "believes", "potential", or variations of such words and phrases or statements that certain actions, events or results "may", "could", "would", "might" or "will be taken", "occur" or "be achieved". Forward-looking statements are subject to known and unknown risks, uncertainties and other factors that may cause the actual results, level of activity, performance or achievements of Wheaton to be materially different from those expressed or implied by such forward-looking statements, including but not limited to:
Forward-looking statements are based on assumptions management currently believes to be reasonable, including but not limited to:
Although Wheaton has attempted to identify important factors that could cause actual results, level of activity, performance or achievements to differ materially from those contained in forward‑looking statements, there may be other factors that cause results, level of activity, performance or achievements not to be as anticipated, estimated or intended. There can be no assurance that forward-looking statements will prove to be accurate and even if events or results described in the forward-looking statements are realized or substantially realized, there can be no assurance that they will have the expected consequences to, or effects on, Wheaton. Accordingly, readers should not place undue reliance on forward-looking statements and are cautioned that actual outcomes may vary. The forward-looking statements included herein are for the purpose of providing readers with information to assist them in understanding Wheaton's expected financial and operational performance and may not be appropriate for other purposes. Any forward-looking statement speaks only as of the date on which it is made, reflects Wheaton's management's current beliefs based on current information and will not be updated except in accordance with applicable securities laws.
Cautionary Language Regarding Reserves and Resources
For further information on Mineral Reserves and Mineral Resources and on Wheaton more generally, readers should refer to Wheaton's Annual Information Form for the year ended December 31, 2024, which was filed on March 31, 2025 and other continuous disclosure documents filed by Wheaton since January 1, 2025, available on SEDAR+ at www.sedarplus.ca. Wheaton's Mineral Reserves and Mineral Resources are subject to the qualifications and notes set forth therein. Mineral Resources, which are not Mineral Reserves, do not have demonstrated economic viability.
Cautionary Note to United States Investors Concerning Estimates of Measured, Indicated and Inferred Resources: The information contained herein has been prepared in accordance with the requirements of the securities laws in effect in Canada, which differ from the requirements of United States securities laws. The Company reports information regarding mineral properties, mineralization and estimates of mineral reserves and mineral resources in accordance with Canadian reporting requirements which are governed by, and utilize definitions required by, Canadian National Instrument 43-101 – Standards of Disclosure for Mineral Projects ("NI 43-101") and the Canadian Institute of Mining, Metallurgy and Petroleum (the "CIM") – CIM Definition Standards on Mineral Resources and Mineral Reserves, adopted by the CIM Council, as amended (the "CIM Standards"). These definitions differ from the definitions adopted by the United States Securities and Exchange Commission ("SEC") under the United States Securities Act of 1933, as amended (the "Securities Act") which are applicable to U.S. companies. Accordingly, there is no assurance any mineral reserves or mineral resources that the Company may report as "proven mineral reserves", "probable mineral reserves", "measured mineral resources", "indicated mineral resources" and "inferred mineral resources" under NI 43-101 would be the same had the Company prepared the reserve or resource estimates under the standards adopted by the SEC. Accordingly, information contained herein that describes Wheaton's mineral deposits may not be comparable to similar information made public by U.S. companies subject to reporting and disclosure requirements under the United States federal securities laws and the rules and regulations thereunder. United States investors are urged to consider closely the disclosure in Wheaton's Form 40-F, a copy of which may be obtained from Wheaton or from https://www.sec.gov/edgar.shtml.
End Notes
1Please refer to disclosure on non-GAAP measures in this press release. Details of the dividend can be found in Wheaton's news release dated March 12, 2026, titled "Wheaton Precious Metals Announces Quarterly Dividend." |
2Statements made in this section contain forward-looking information with respect to forecast production, production growth, funding outstanding commitments, continuing to acquire accretive mineral stream interests and the commencement, timing and achievement of construction, expansion or improvement projects and readers are cautioned that actual outcomes may vary. Please see "Cautionary Note Regarding Forward-Looking Statements" for material risks, assumptions and important disclosure associated with this information. |
3Gold equivalent forecast production for 2025 and the longer-term outlook are based on the following updated commodity price assumptions: $2,600 per ounce gold, $30 per ounce silver, $950 per ounce palladium, $950 per ounce of platinum and $13.50 per pound cobalt. |
4Source: Company reports S&P Global estimates of 2025 byproduct cost curves for gold, zinc/lead, copper, PGM, nickel & silver mines |
5Total streaming and royalty agreements relate to precious metals purchase agreements for the purchase of precious metals and cobalt relating to 23 mining assets which are currently operating, 23 which are at various stages of development, and 2 of which have been placed in care and maintenance or have been closed. |
6Further details for long-term guidance can be found in the Wheaton news release dated February 16, 2026, titled "Wheaton Precious Metals Exceeds 2025 Production Guidance and Provides 2026 and Long-Term Outlook, Projecting Approximately 50% Growth to 1.2 Million Gold Equivalent Ounces by 2030." |
7Wheaton's long-term production outlook is based on information available as of February 16, 2026, the date of publication. |
8Gold equivalent ounces for 2026 and long-term guidance are calculated by converting silver, palladium, platinum and cobalt to a gold equivalent by using the following commodity price assumptions: $4,800 per ounce gold, $80 per ounce silver, $1,500 per ounce Palladium, $2,000 per ounce Platinum, and $25 per pound Cobalt. |
9Under the terms of the Kurmuk PMPA, within 30 days of a change of control Allied has a one-time option to repurchase one-third of the gold stream for an amount ensuring a fixed internal rate of return to the Company. |
View original content:https://www.prnewswire.com/news-releases/wheaton-precious-metals-announces-record-annual-revenue-earnings-and-cash-flow-for-2025-302712794.html
SOURCE Wheaton Precious Metals Corp.
View original content: http://www.newswire.ca/en/releases/archive/March2026/12/c7597.html
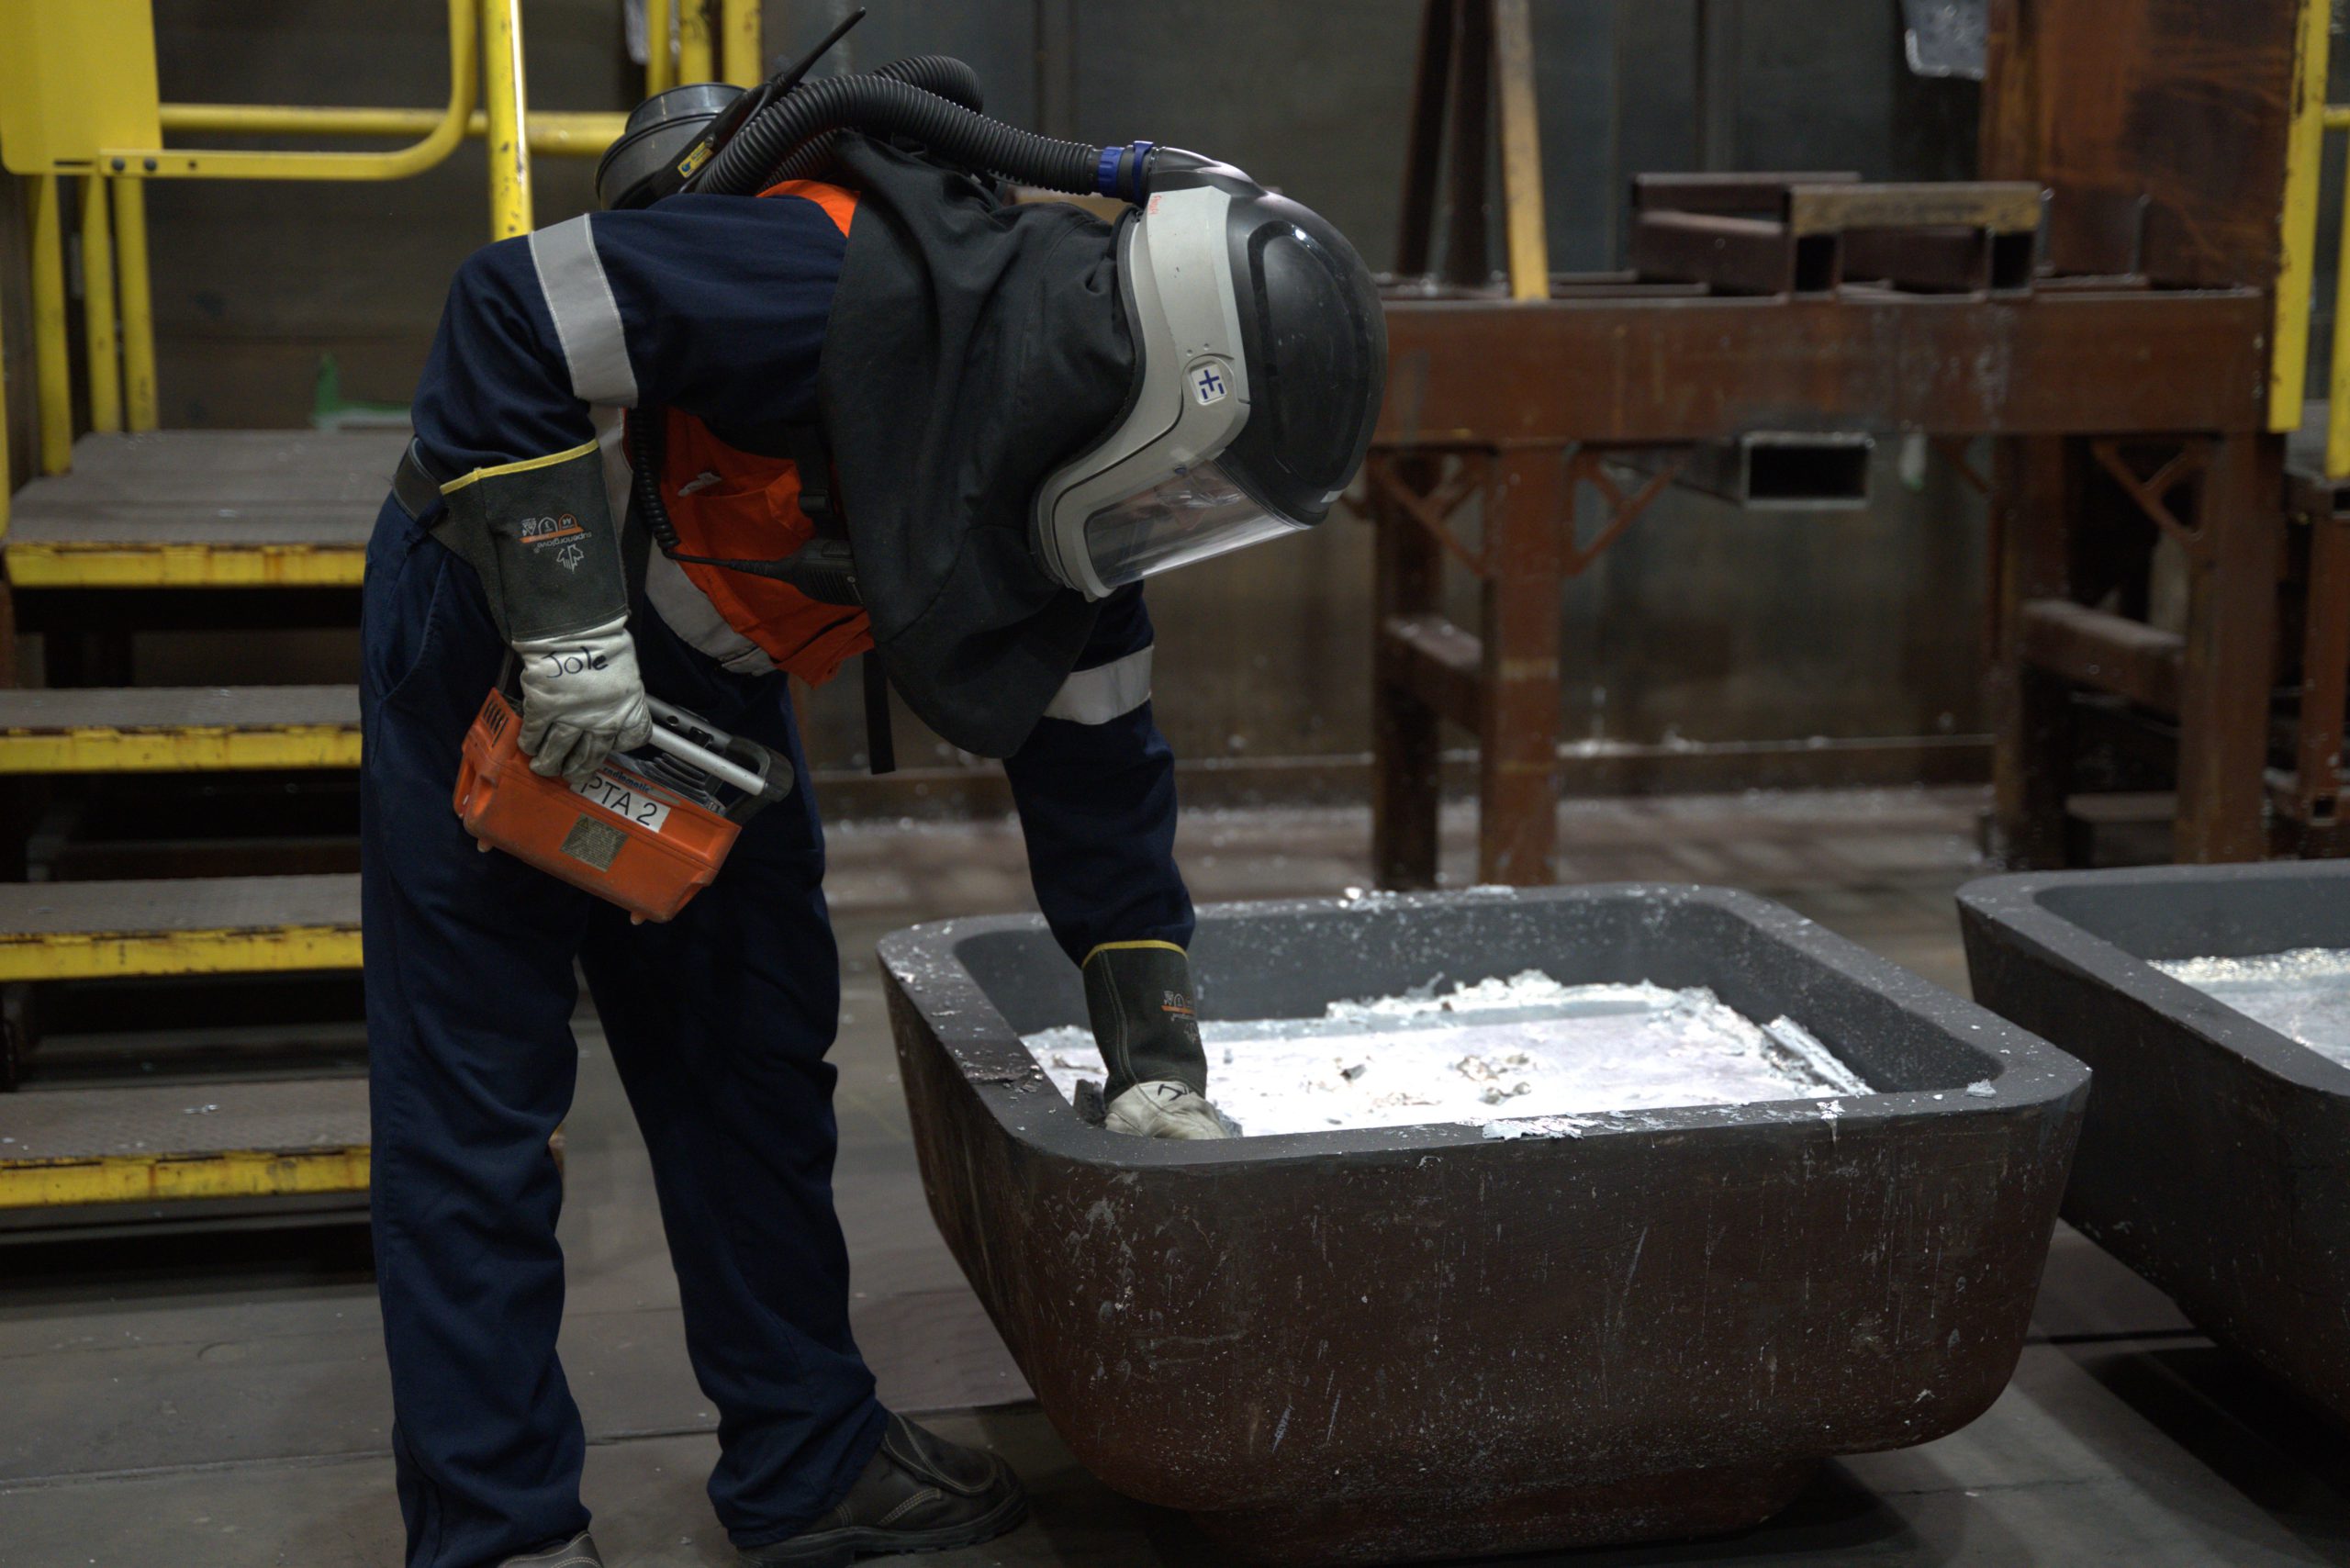

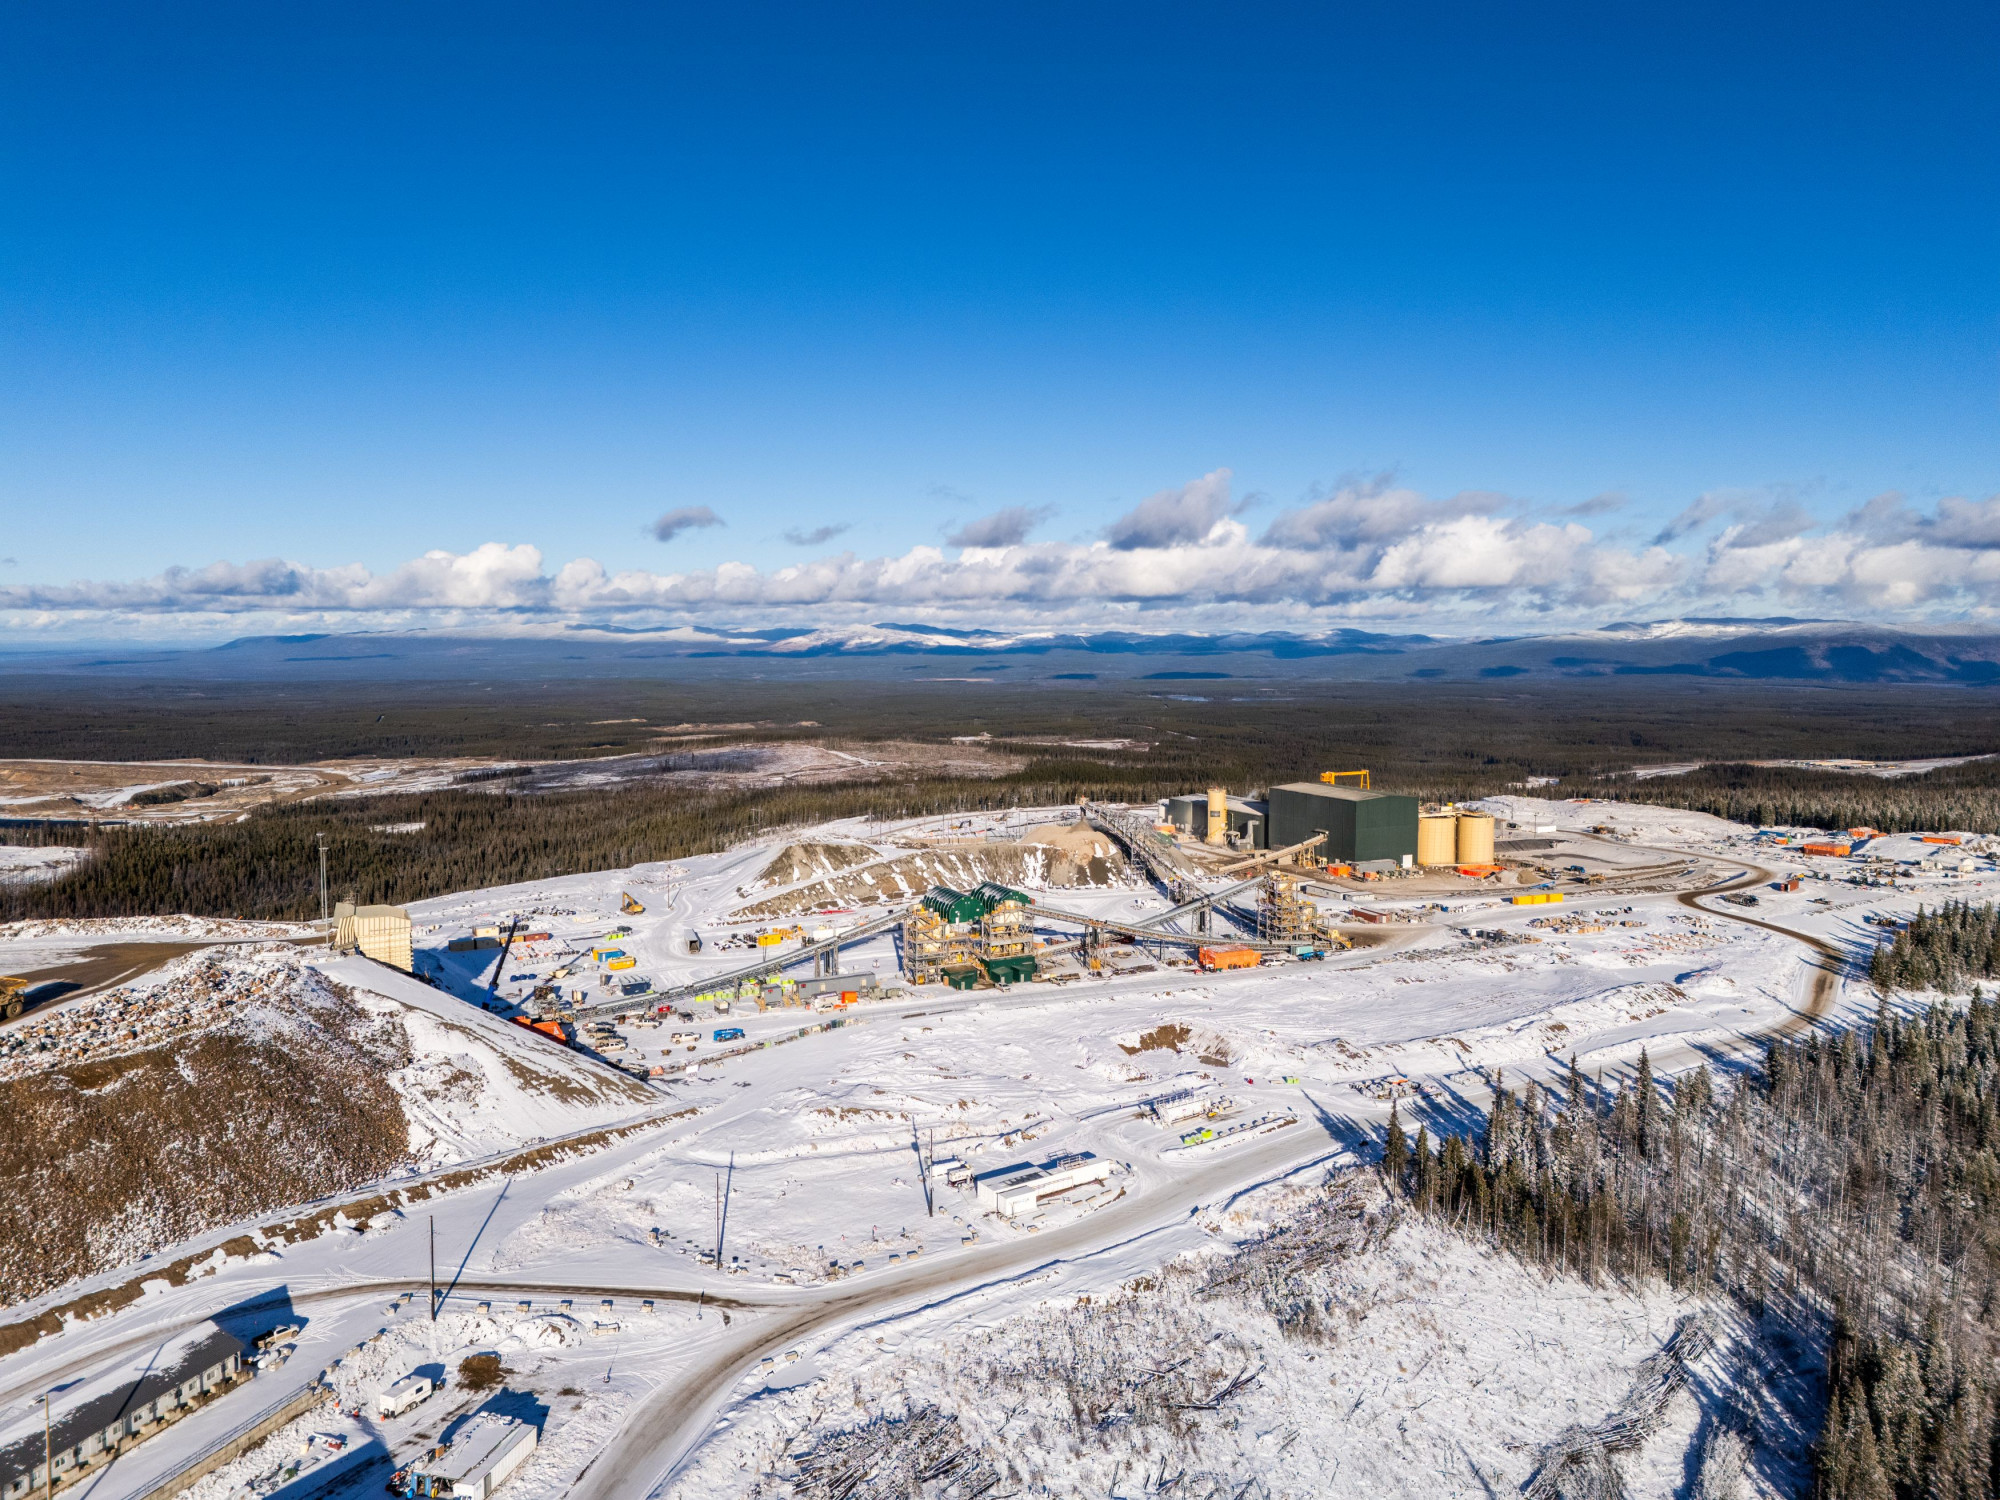
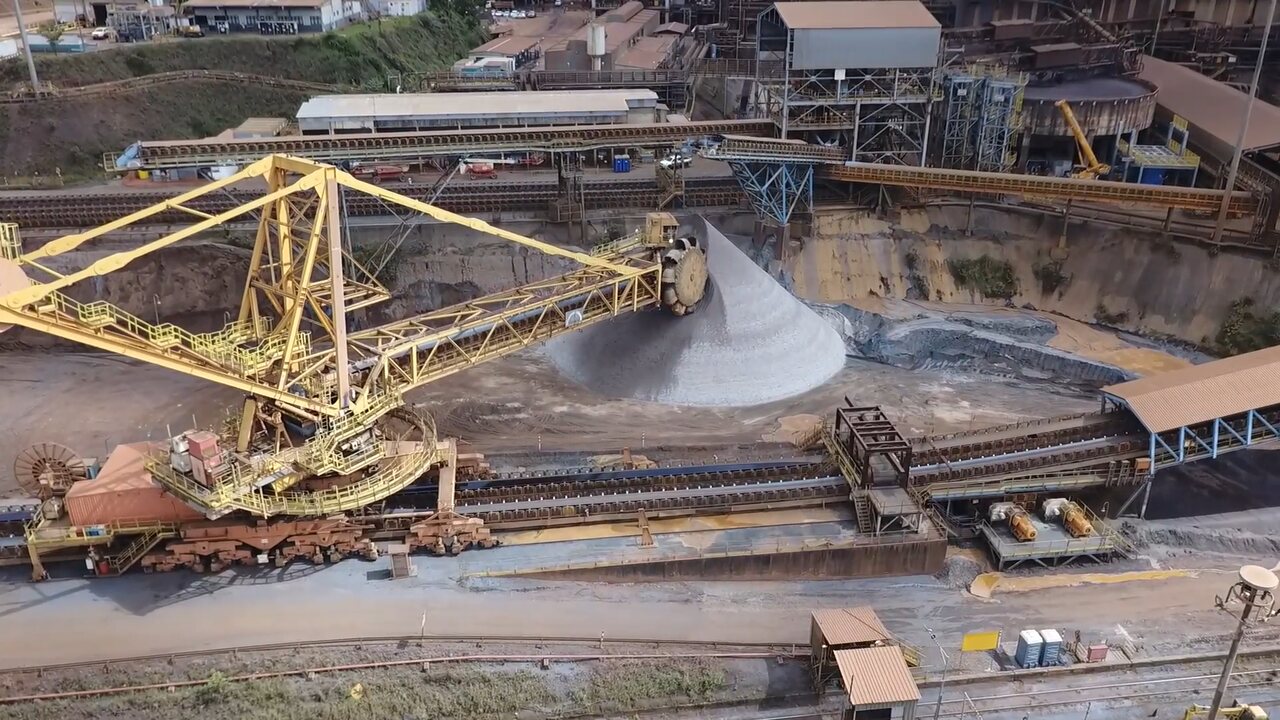


The new Mining Power Rankings are live. Vote for the sector’s leaders in each of the Large-, Small-, and Micro-Cap leagues.