CHARTS: New study shows global mining is now a brownfield industry
The dearth of new greenfield mines – particularly copper – has been a problem for the industry for decades.
A new study by the University of Queensland’s Sustainable Minerals Institute provides stark evidence of the extent of the problem and just how reliant global mining has become on brownfield expansion.
The massive need for more copper to enable the energy transition and much besides has achieved near universal consensus and so has the argument that demand cannot be met by expanding existing mines alone.
Copper can account for nearly 6% of the capital expenditure of a data center project and the trillions of dollars flowing into electricity and compute to teach robots how to fold laundry will mean you need a new Cobre Panama every two years (and those are hard to come by and even harder to keep).
It’s not surprising that copper miners have turned to brownfielding despite ever lower grades necessitating ever bigger, deeper and costlier expansions. Not when it takes nearly 14 years just to bring a copper project to the preliminary economic assessment stage and at least another four for construction if you’re lucky, very lucky, to get permits.
The study published in the OneEarth journal, covered 366 brownfield sites, across 58 countries and 16 minerals, global production, exploration, and capital-expenditure data from 1998 to 2024.
Deanna Kemp, first author of the study, says brownfielding often unfolds incrementally over time with less public scrutiny:
“Once a mine has been approved and permitted, expansion is typically a business-as-usual part of developing a mine, even when that expansion changes the original risk of social and environmental impact.
“In the “’middle’” of a mine’s lifespan, when the mine is active there is often less oversight or public focus: changes tend to be regulated, step by step, but the impacts of these expanded operations add up over time.”
“The risk factors involved in each mine site are unique and no-one has really been looking at the scale of growth of brownfield mining globally.”
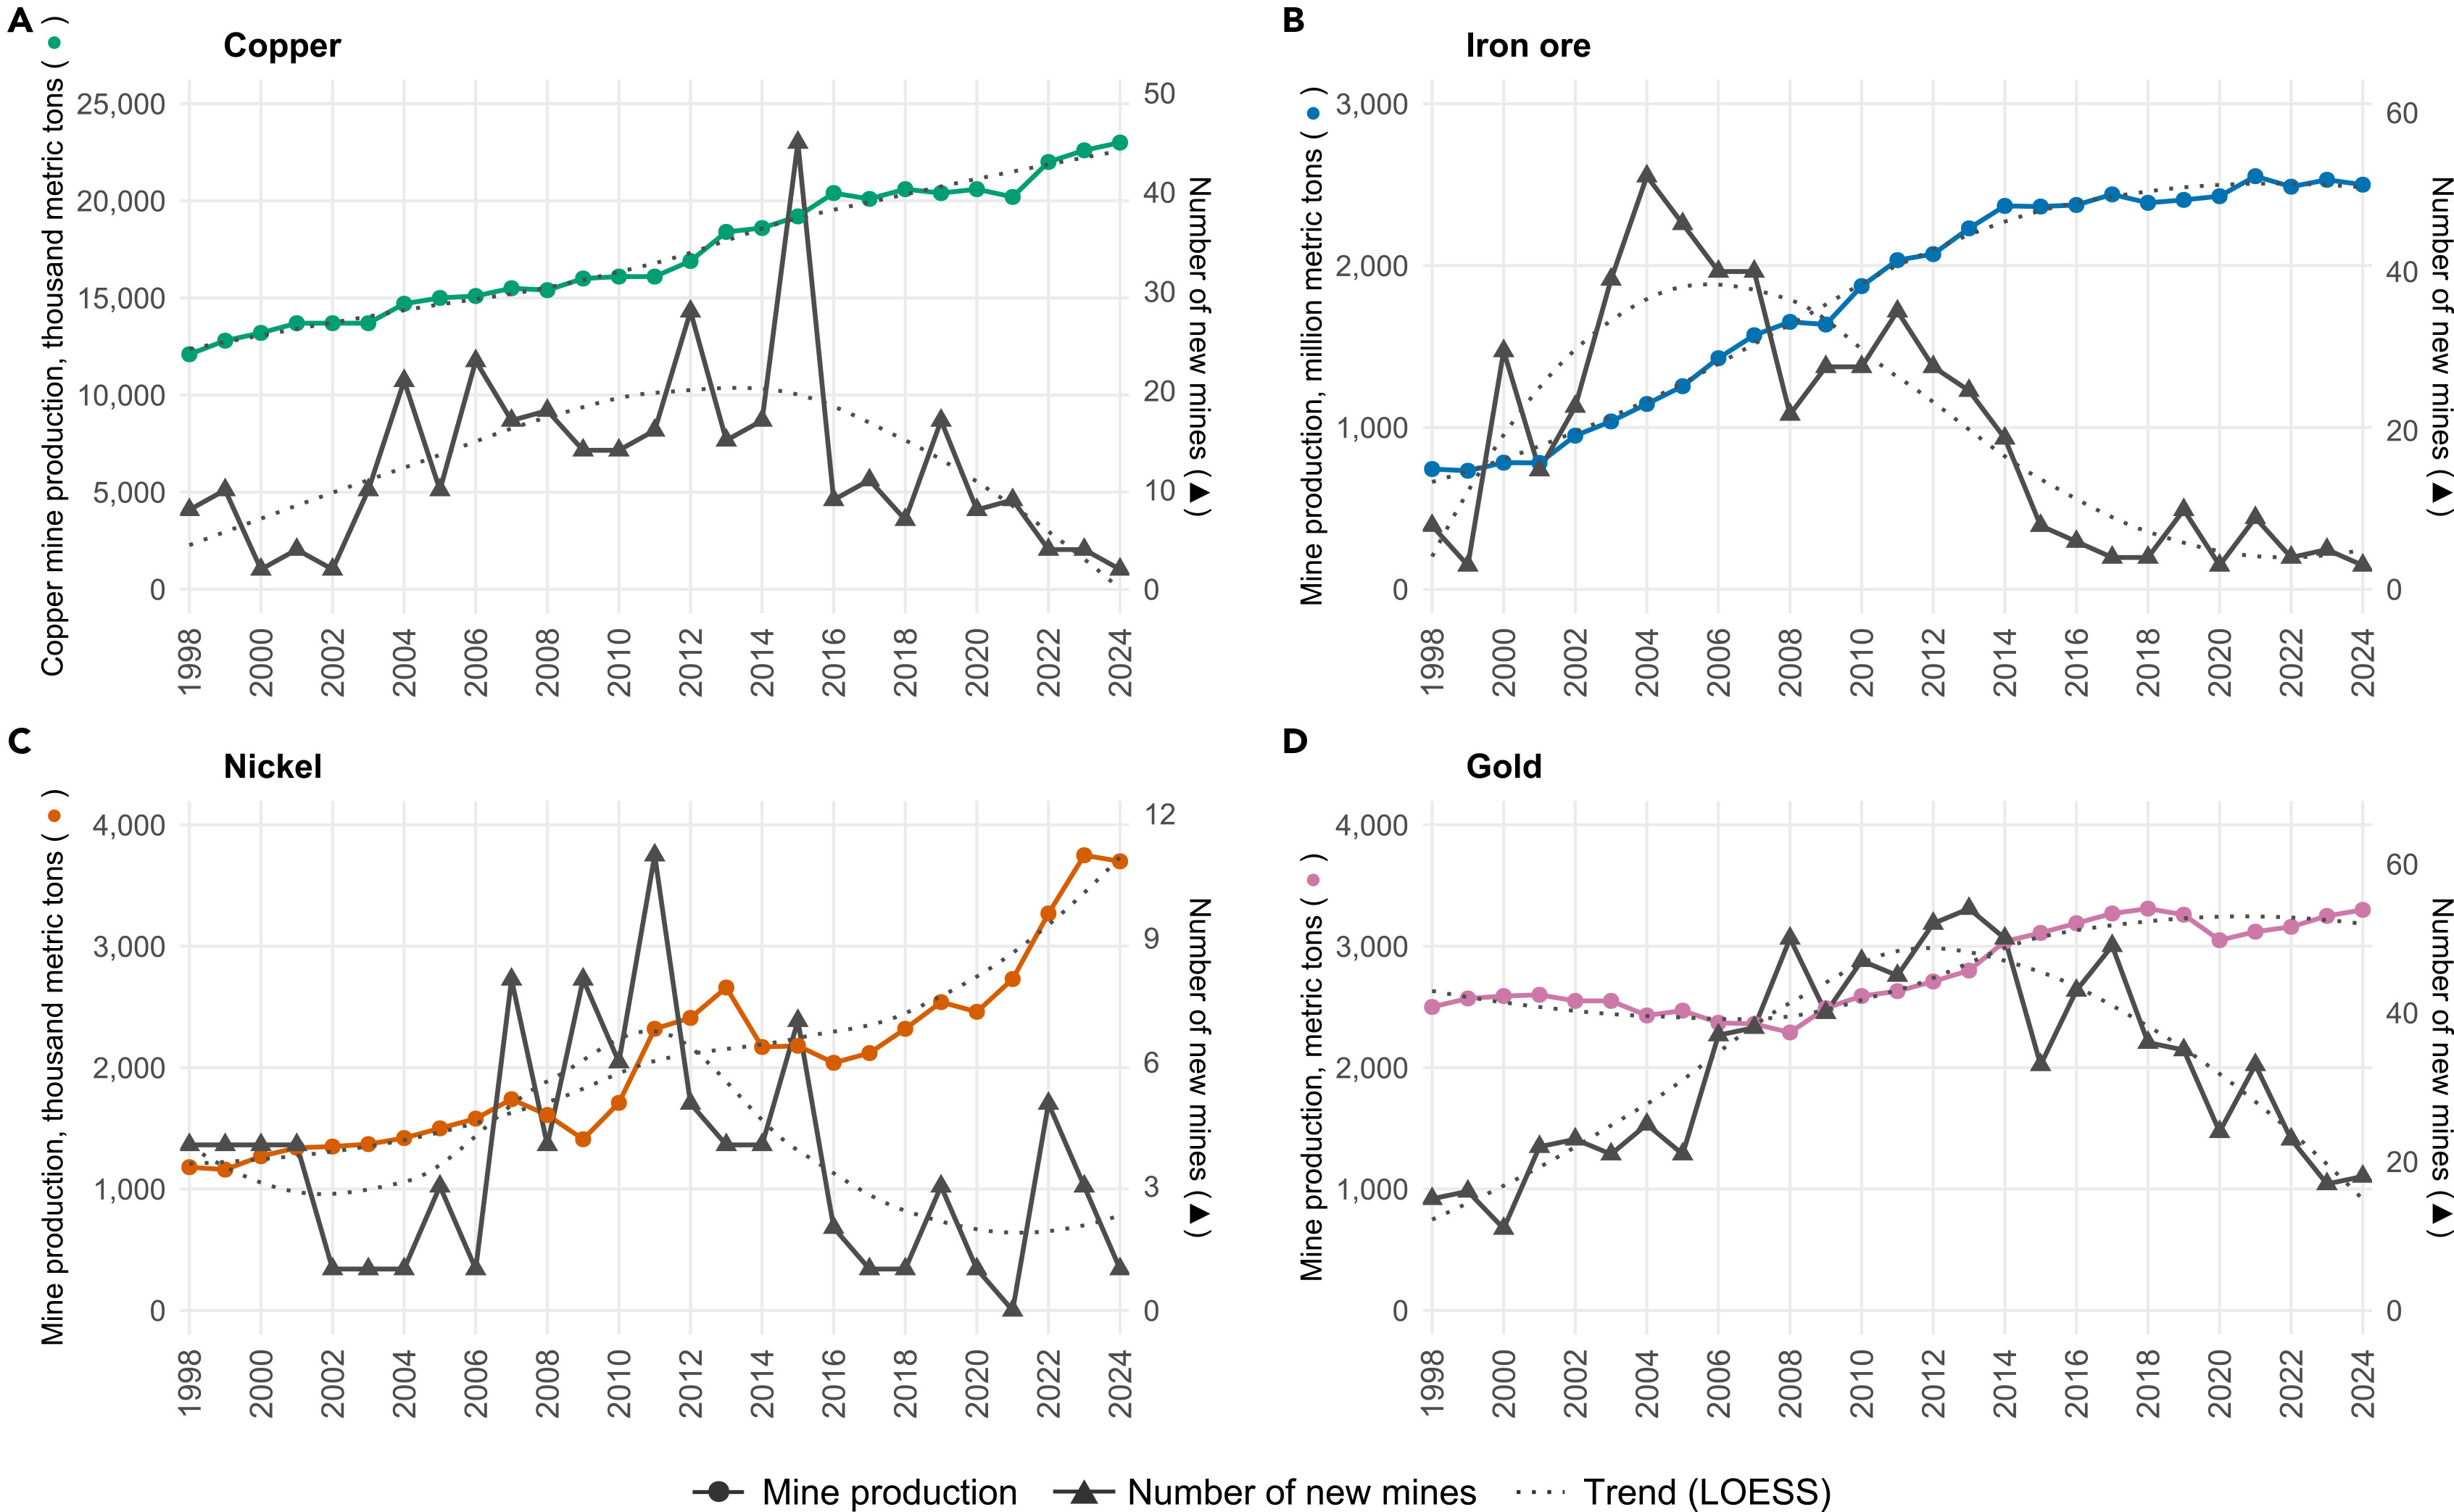
According to study, the number of new mines peaked around 2015 for copper, in the early 2000s for iron ore, around 2010–2012 for nickel, and around 2012–2014 for gold. However, since these peaks, and the subsequent decline in the numbers of new mines, production has continued to rise.
Brownfield capital expenditure is dominated by copper, constituting just under half the total spent followed by gold (17.5%), iron ore (14.4%), and nickel (6.3%).
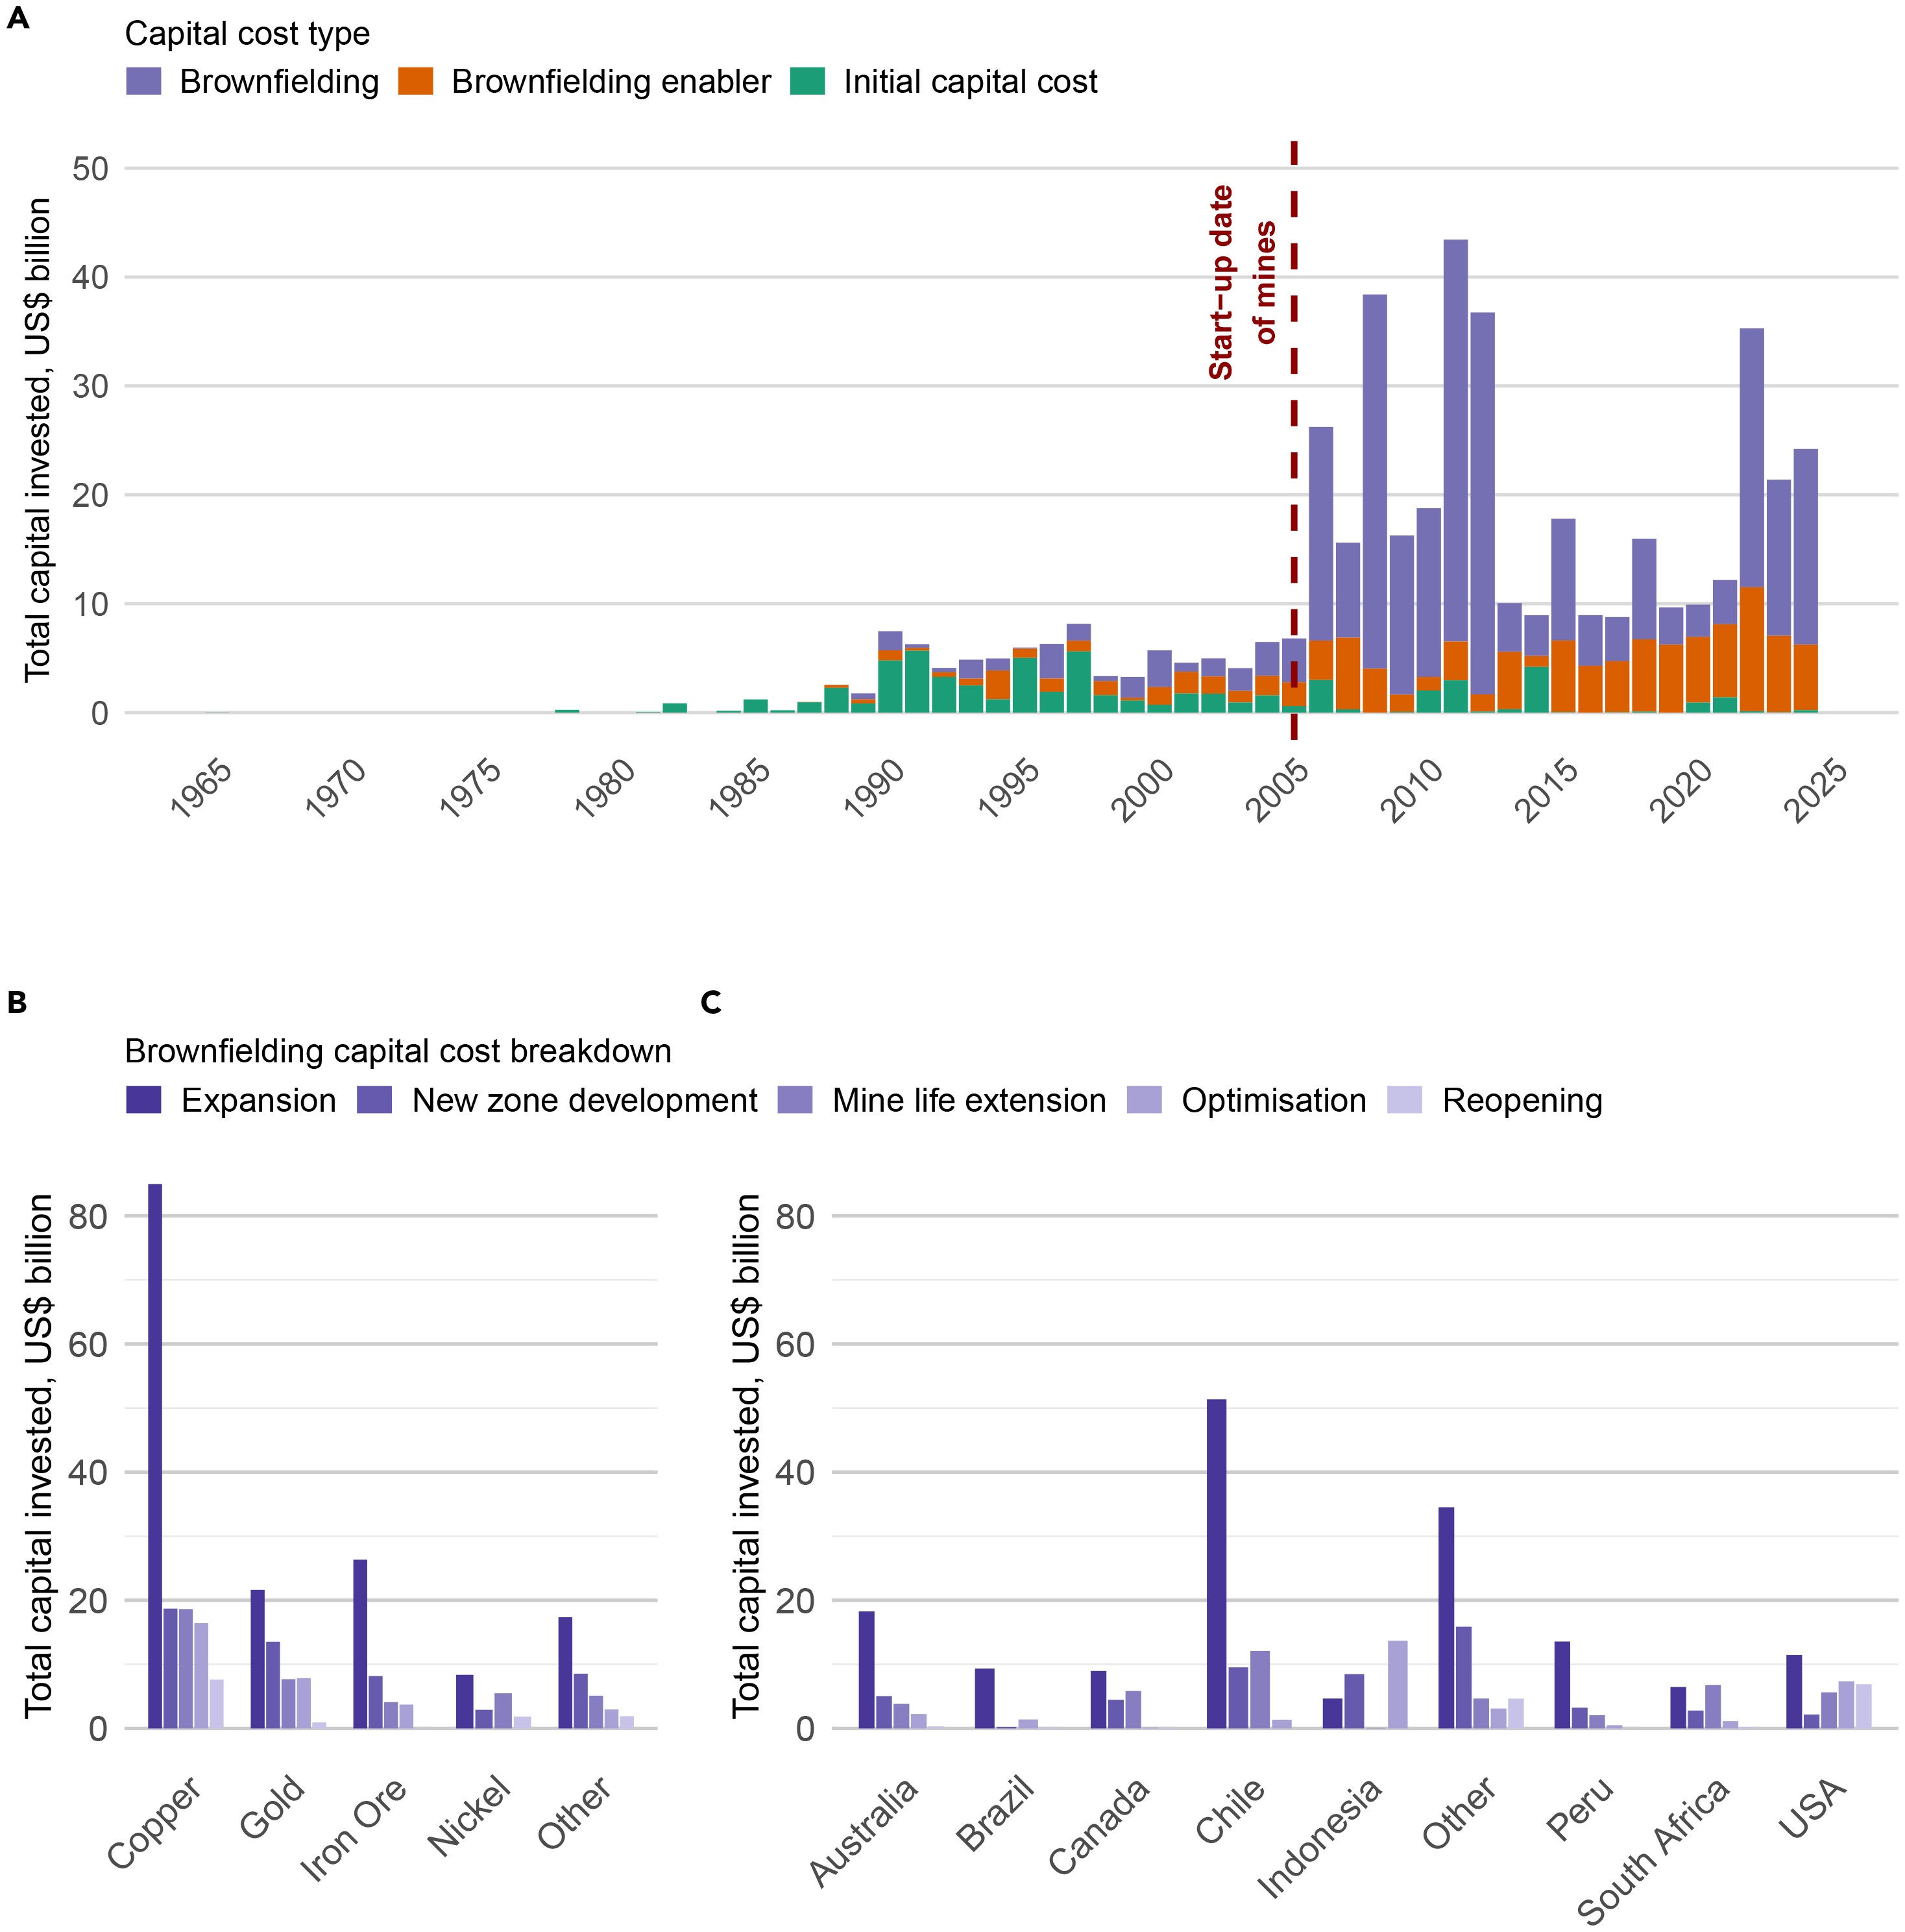
Across minerals, brownfielding capital is dominated by physical “expansion,” followed by “new zone development” and “mine life extension,” while “optimization” and “reopening” are comparatively small.
The study found that Chile leads global brownfield development, with 25.2% of total worldwide capital investment, followed by the United States (11.4%) and Australia (10.1%).
According to the report, the pattern of increasing minesite exploration by major companies holds across all global regions with the early 2020s marked as turning point.
The pattern is most pronounced in Pacific and Southeast Asia, where the share rises from 27.3% in 2010 to 76.8% in 2024, alongside a marked decline in late stage and feasibility exploration.
Africa and Latin America retain relatively larger grassroots exploration shares, but regions both show a shift toward minesite exploration over time, increasing from 42.5% to 65.4% in Africa and from 27.1% to 63.0% in Latin America between 2010 and 2024.
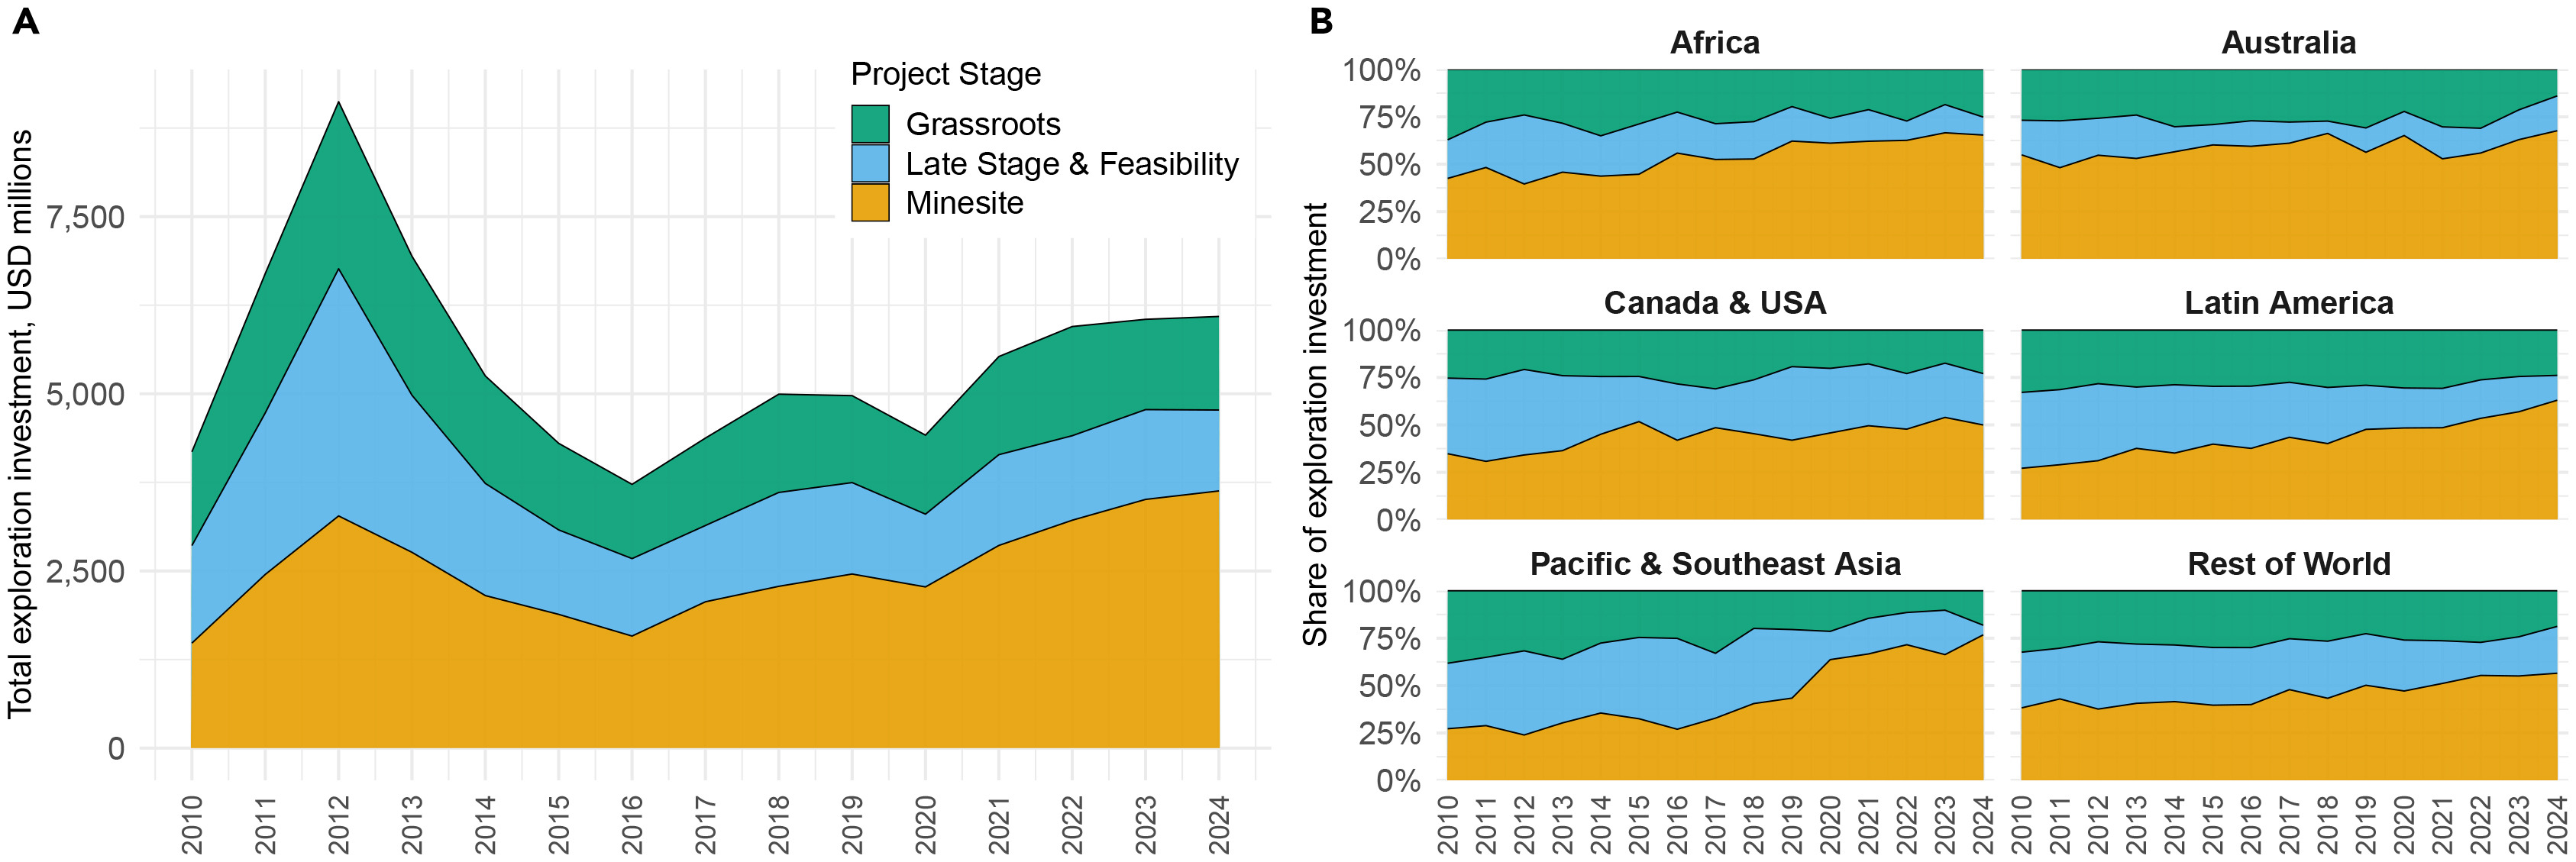
In Australia, work on expansion dominates spending throughout the period while Canada and the US lean more toward late stage and feasibility exploration, with minesite activity rising from 34.8% in 2010 to just under half in 2024.
According to the authors, nearly 80% of the brownfield mines analyzed using satellite imagery are in locations facing multiple high-risk conditions, which also include water scarcity, weak governance, and limited press freedom.
More than one-fifth of the sites lie within 50 kilometers (31 miles) of ecologically pristine or partially modified areas, and more than half of the sites are located within 20 kilometers (12 miles) of biodiversity hotspots or protected areas.
More News

{{ commodity.name }}
{{ post.title }}
{{ post.date }}


Comments
Jeff
Developing a new mine is a multi-billion dollar operation. If you are doing a greenfield development the bulk of the investment is an upfront outlay and I suspect that upfront cost is 75 to 85 % of the total investment for the property. That is a lot of money at risk before you ever take anything out of the ground that can be sold. Brownfield development is cheaper, safer and adds to the roi of the existing sunk cost. No surprise that Brownfield investment is much more attractive than Greenfield projects. This is unfortunately the nature of the mining industry that will never change.