TRADE REVIEW: Asian iron ore buyers reassess options in Q3 as key Pilbara brands degrade
Published : 27 Aug 2025 | Analysis
Author: Keith Tan, [email protected], Zhuo ling Heng, [email protected], Kyla Koh, [email protected] | Iron
Australian brand degradation shifts supply, demand
Mainstream product demand to continue into Q3
High-grade materials set for more uptake: end-users
This report is part of the S&P Global Commodity Insights' Metals Trade Review series, where we dig through datasets and digest some of the key trends in iron ore, metallurgical coal, copper, alumina, cobalt, lithium, nickel and steel and scrap.
We also explore what the next few months could bring, from supply and demand shifts to new arbitrages and quality spread fluctuations.
The Asian seaborne iron ore market is expected to see continued buyer reassessment in the third quarter, as spot prices hover near a nine-month low of $92.75/dmt and the degradation of key Western Australia's Pilbara brands raises concerns over long-term supply reliability.
The Platts Iron Ore Index, or IODEX, averaged $97.76/dmt CFR North China in Q2, down 5.67% from Q1 and 12.57% from Q2 2024. Platts is part of S&P Global Commodity Insights.
Analysts at Commodity Insights forecast the IODEX at $98.40/dmt for Q3 and $99.18/dmt for full-year 2025.
"We expect iron ore prices to come under slightly more pressure over the remainder of the year, as Chinese steel production is usually lower in the second half of the year, while at the same time, iron ore exports are strong," Paul Bartholomew, senior analyst for metals and mining at Commodity Insights, said.
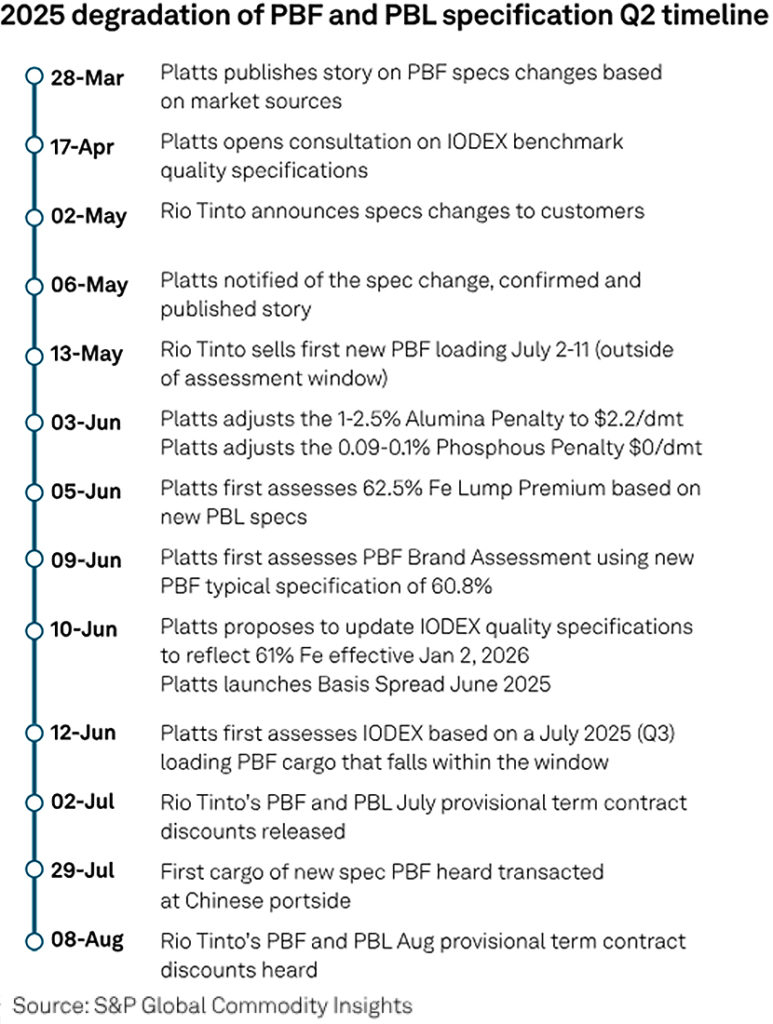
Market participants faced uncertainty after Rio Tinto announced revised specifications for its flagship Pilbara Blend Fines for Q3, set at 60.8% Fe, 2.5% alumina, 4.3% silica and 0.11% phosphorus.
With the first cargoes of the new PBF loaded in early July, Chinese steelmakers said they would closely monitor the brand's performance, as end-users cannot blend, sinter or test the updated product in their blast furnaces until August at the earliest.
The first cargoes of the new PBF were discharged at North China ports in late July, with iron content in the 60.6%-61.6% range, according to data compiled by Platts.
While some buyers welcomed the first cargoes of the new PBF, with iron content reaching over 61%, others said they would closely monitor quality consistency in the coming months.
"I don't mind if the iron content has dropped, but it should be consistent," an East China-based buyer said. "What's not good is having it high in some shipments and low in others - - it's like opening a blind box."
PBF trades in the seaborne market on a 61% Fe pricing basis, with prepayments made accordingly, while the final cargo price is typically adjusted based on quality as determined by discharge port analysis, market sources said.
"The adjustment on a dollar basis [based on discharge port analysis] may be insufficient to offset the discount the cargo would fetch when sold as port stocks," the buyer said, adding that a spread of up to Yuan 40/wmt ($5.60/wmt) could apply for port stock trades.
Quality inconsistency can also complicate operational planning at large blast furnaces, the buyer said.
PBF differential seen stabilizing
With BHP also revising specifications across its flagship medium-grade products - - Mining Area C Fines, Jimblebar Fines and Newman High Grade Fines - - market participants are closely watching Q3 for shifts in the medium-grade fines landscape, drawing new comparisons between PBF and MACF given their now comparable specifications.
Market participants noted that Rio Tinto and BHP took different approaches to updating their specifications. Rio Tinto provided buyers with advance notice before delivering the new-quality PBF cargoes, offering greater transparency, though the two-month purchase-to-consumption cycle still left some valuation uncertainty.
By contrast, BHP gradually delivered lower-quality fines before announcing updated specifications, leading buyers to largely view the announcement as confirmation of what they had already received in practice.
In terms of spot sales, Rio Tinto has so far sold its updated PBF in the seaborne market on a fixed-price basis rather than a floating-price basis, according to data compiled by Platts.
While initial transactions - - expressed as a differential to the front-month futures price - - reflected a $2.20/dmt discount to the front-month 62% Fe IODEX, this has since stabilized around $1.60/dmt, similar to levels seen for BHP's discounted MACF, the data showed.
Following the specification changes, spot transactions from mid-August saw the spread between PBF and MACF narrowing, the data showed, with the additional brand premium for MACF falling to $0/dmt from $2.15/dmt on Aug. 18.
Before PBF's premium levels declined, market participants cited metallurgical properties and quality consistency as the main drivers of the price spread between PBF and MACF.
Medium grades to gain foothold
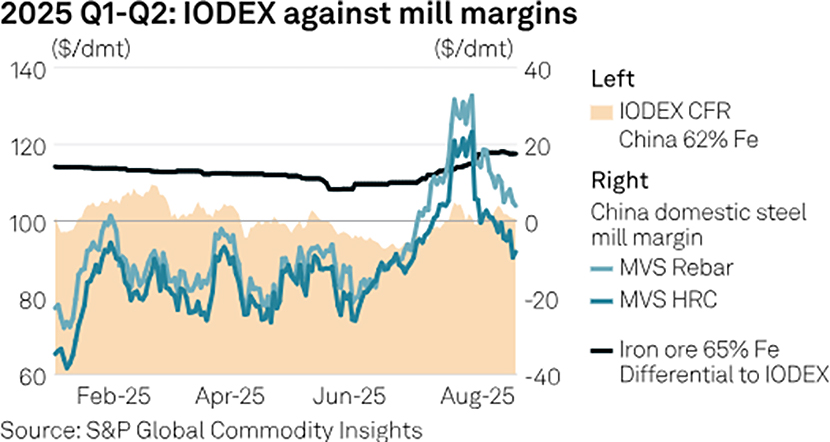
Amid market adjustments and shifting tolerances in the medium-grade fines segment, market sources said falling raw material costs have prompted Chinese mills to return from discounted non-mainstream materials to mainstream medium-grade fines in Q3, supported by improved Q2 margins.
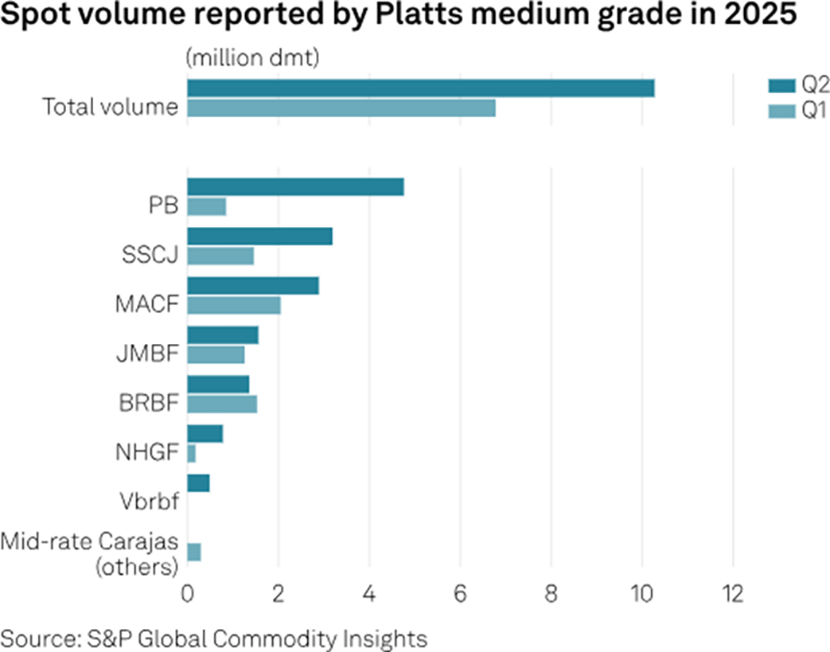
Meanwhile, supply gluts from Australian miners following Q1 post-hurricane disruptions added further pressure and kept prices competitive, with the five mainstream brands accounting for 83.2% of total spot trades in Q2, up from 77.5% in Q1, according to data compiled by Platts.
Liquidity for PBF returned to the spot market after its adjustments, with 4.76 million dmt traded in Q2 - - up 82% from Q1 - - including 1.7 million dmt of PBF under the renewed specifications, the data showed.
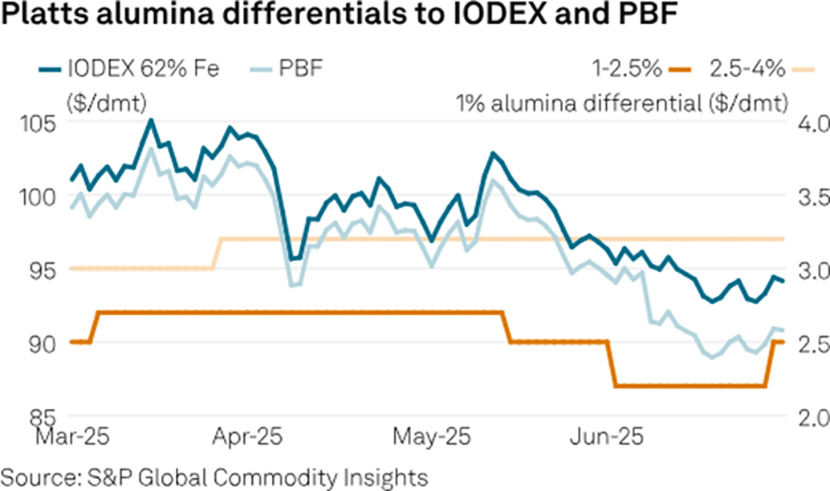
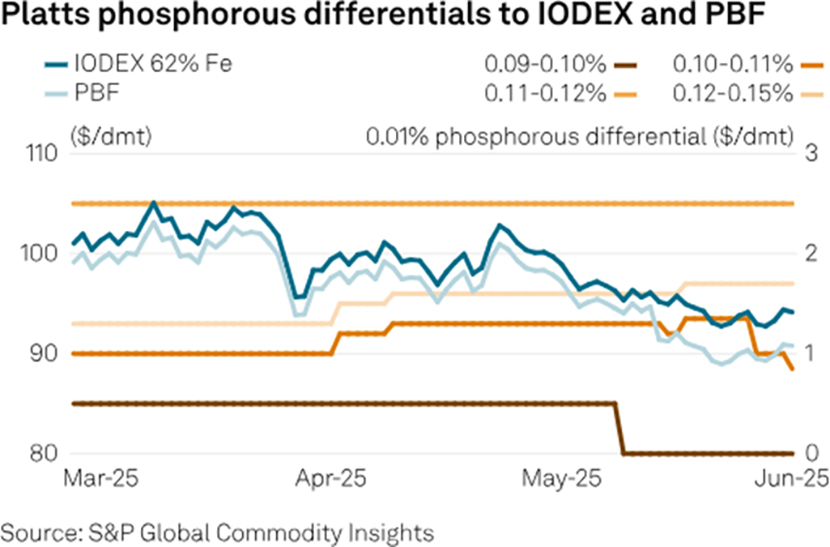
With PBF's phosphorus content rising to 0.1%, the market had to adjust to higher levels in a major brand. Given the relatively low phosphorus in Chinese domestic and imported concentrates, some steelmakers noted increasing tolerance for the 0.09%-0.1% range, with implied penalties expected to narrow accordingly.
On June 3, Platts lowered the phosphorus differential to $0/dmt for the first-band penalties of 0.09%-0.1% phosphorus.
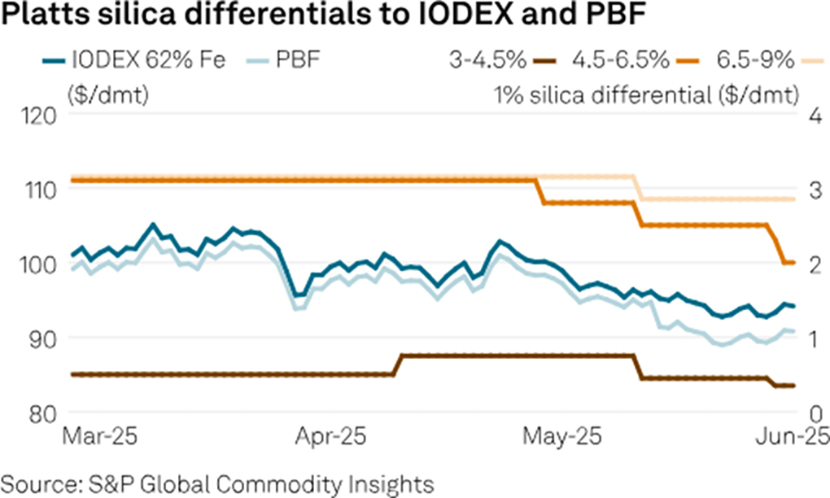
Alongside PBF's increased spot market liquidity, which also influenced tolerance for higher-silica cargoes, Q2 saw four rounds of Chinese domestic coke price cuts of Yuan 50-75/dmt each, according to local media reports.
This further supported consumption of higher-impurity, medium-grade sinter fines, market sources said, with the Platts-assessed silica differential narrowing over the quarter.
High grades to see more demand
While the medium-grade segment remained attractive to Chinese steel mills, early Q2 loading delays for high-grade Carajas by Brazilian miner Vale have kept the 65/62 spread elevated - - a trend that may persist into Q3, market sources said.
More replacement sell tenders for non-mainstream mid-rate Carajas cargoes emerged in the spot seaborne market, while Vale also updated its IOCJ portfolio amid the evolving iron ore market.
Additionally, Q2 saw increased use of domestic and imported concentrates as supplies built up in both domestic and seaborne markets, according to data compiled by Platts.
Market sources said early-May disruptions to Peruvian concentrate supply boosted demand and use of low-silica concentrates - - particularly Anglo American's Minas Rio and Vale's Pellet Feed Premium Acu - - supporting the high-Fe pellet feed market.
As market participants brace for a lower-Fe, higher-silica landscape amid degradations in the medium-grade segment, high-grade products are likely to see greater uptake among mills blending feed, particularly with Rio Tinto's Simandou mine set to boost high-grade supply in the near term.

Source: S&P Global Commodity Insights, ©2024 by S&P Global Inc.
© 2024 by S&P Global Inc. All rights reserved.
S&P Global, the S&P Global logo, S&P Global Commodity Insights, and Platts are trademarks of S&P Global Inc. Permission for any commercial use of these trademarks must be obtained in writing from S&P Global Inc.
You may view or otherwise use the information, prices, indices, assessments and other related information, graphs, tables and images (“Data”) in this publication only for your personal use or, if you or your company has a license for the Data from S&P Global Commodity Insights and you are an authorized user, for your company’s internal business use only. You may not publish, reproduce, extract, distribute, retransmit, resell, create any derivative work from and/or otherwise provide access to the Data or any portion thereof to any person (either within or outside your company, including as part of or via any internal electronic system or intranet), firm or entity, including any subsidiary, parent, or other entity that is affiliated with your company, without S&P Global Commodity Insights’ prior written consent or as otherwise authorized under license from S&P Global Commodity Insights. Any use or distribution of the Data beyond the express uses authorized in this paragraph above is subject to the payment of additional fees to S&P Global Commodity Insights.
S&P Global Commodity Insights, its affiliates and all of their third-party licensors disclaim any and all warranties, express or implied, including, but not limited to, any warranties of merchantability or fitness for a particular purpose or use as to the Data, or the results obtained by its use or as to the performance thereof. Data in this publication includes independent and verifiable data collected from actual market participants. Any user of the Data should not rely on any information and/or assessment contained therein in making any investment, trading, risk management or other decision. S&P Global Commodity Insights, its affiliates and their third-party licensors do not guarantee the adequacy, accuracy, timeliness and/or completeness of the Data or any component thereof or any communications (whether written, oral, electronic or in other format), and shall not be subject to any damages or liability, including but not limited to any indirect, special, incidental, punitive or consequential damages (including but not limited to, loss of profits, trading losses and loss of goodwill).
ICE index data and NYMEX futures data used herein are provided under S&P Global Commodity Insights’ commercial licensing agreements with ICE and with NYMEX. You acknowledge that the ICE index data and NYMEX futures data herein are confidential and are proprietary trade secrets and data of ICE and NYMEX or its licensors/suppliers, and you shall use best efforts to prevent the unauthorized publication, disclosure or copying of the ICE index data and/or NYMEX futures data. Permission is granted for those registered with the Copyright Clearance Center (CCC) to copy material herein for internal reference or personal use only, provided that appropriate payment is made to the CCC, 222 Rosewood Drive, Danvers, MA 01923, phone +1-978-750-8400. Reproduction in any other form, or for any other purpose, is forbidden without the express prior permission of S&P Global Inc. For article reprints contact: The YGS Group, phone +1-717-505-9701 x105 (800-501-9571 from the U.S.).
For all other queries or requests pursuant to this notice, please contact S&P Global Inc. via email at [email protected].


Comments