Goldman expects wave of South Africa deals fueled by commodities
“We are in the late stage of a commodity boom, with gold spiking and platinum prices rebounding strongly," Goldman's Simon Denny says.

92,000MT ANNUAL PAYABLE CU PRODUCTION (1st 10 Years)
$1.81/lb C1 COST and $2.05/lb AISC (1st 10 Years)
US$1.351bn AFTER-TAX NPV8%
20.1% AFTER-TAX IRR
23 YEAR MINE LIFE
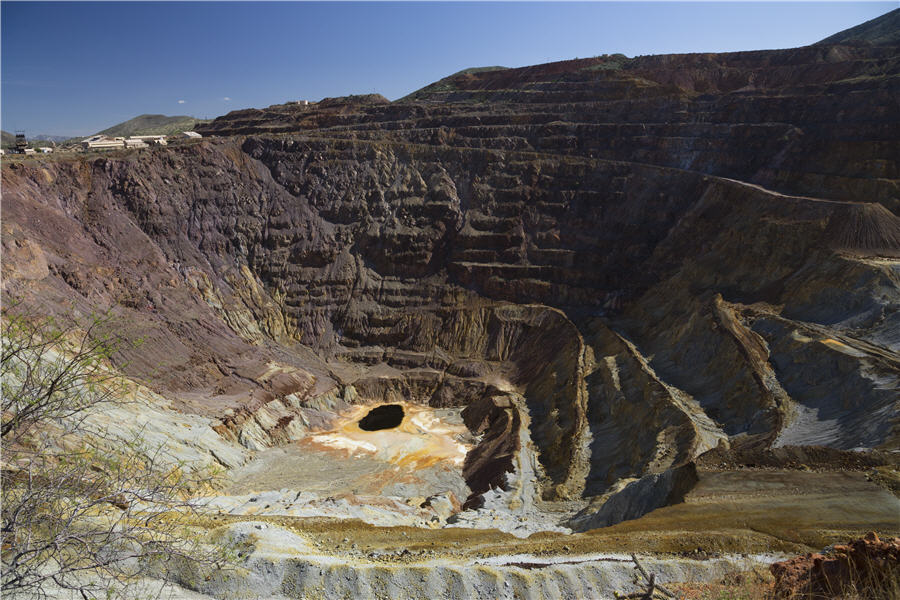
The Haib project is a simple, scalable, advanced-stage, open pit sulphide Cu/Mo project located at low altitude in an ideal, infrastructure-rich area of southern Namibia close to the South African border. It was formerly owned by Rio Tinto and Teck, and since the end of 2024 is under credible, new Namibian leadership & management with (i) the stated aim of optimizing, right-sizing and de-risking the project towards an investment decision and/or asset/equity sale, and (ii) a fifteen (15) year track record of successful Namibian mine development and project exits.
The preliminary economic assessment (“PEA”) objective is to reset the project scope & reposition Haib as a credible, large-scale, long-life, low-risk and low-cost open pit milling & flotation mine plus supplemental heap leach production. The PEA is based on the 2024 Mineral Resource Estimate (“MRE”) block model that was used to report the 31 August 2024 MRE, with none of the drilling since then included in this PEA. All additional drilling and extensive geological re-modelling will be reflected in an updated MRE and technical study to be published in the second half 2026.
Significant further upside to be unlocked through ongoing drilling (potential size and grade improvements) and metallurgical and sorting testwork (scalability and potential cost reductions) which will be reflected in the next technical study.
PEA Highlights
Register: https://us06web.zoom.us/webinar/register/WN_qUZaHmJdTTyMb21V_tNvlw
Please join the Koryx team for the discussion & presentation followed by Q&A.
VANCOUVER, British Columbia, Sept. 04, 2025 (GLOBE NEWSWIRE) -- Koryx Copper Inc. (“Koryx” or the "Company") (TSX-V: KRY) is pleased to announce the results of the recently completed Preliminary Economic Assessment (“PEA”) of the Company’s 100%-owned, flagship Haib Copper Project (“Haib” or the “Project”) in southern Namibia.
Heye Daun, Koryx Copper’s President and CEO commented as follows: "We are highly encouraged with the very good results of this PEA, notwithstanding the fact that it is still based on the 2024 Mineral Resource model and does NOT yet reflect all of the excellent drill results produced since late 2024. The objective of this PEA was (i) to right-size and optimize the Haib project and reposition it as a credible, low-risk, large-scale, low-cost, high-return, open pit milling & flotation operation, and (ii) to demonstrate Koryx’s material undervaluation when compared to other Cu development equities.”
“With a Cu production rate of 92,000 tonnes per annum, a post-tax NPV8% of +US$1.35n, upfront capital cost of US$1.56bn, low C1 cash cost of US$1.81/lb of Cu (AISC of US$2.05/lb of Cu during the first 10 years of production and a long mine life of 23 years, Haib stands out as an emerging, top-quality, near-term African copper development project.”
“What makes this project truly unique however are a few of its key attributes, namely its simplicity, scalability, low risk, ideal location at low altitude, close to water and power infrastructure, with low capital intensity, low operating costs, a predictable permitting environment and lack of any technical, environmental or social fatal flaws. This suggests that this project could be rendered shovel-ready, with an advanced feasibility study, secure water and power supply and most major permits in place within just a few years.
”Lead by a strong and motivated technical team that has the drive and in-country experience of having recently advanced and permitted a major gold mine development in Namibia (Osino Resources’ Twin Hills gold project which is presently in construction), we look forward to successfully delivering another excellent large-scale mine development project in Namibia (now our 3rd one in the past 15 years).”
Property Description and Ownership
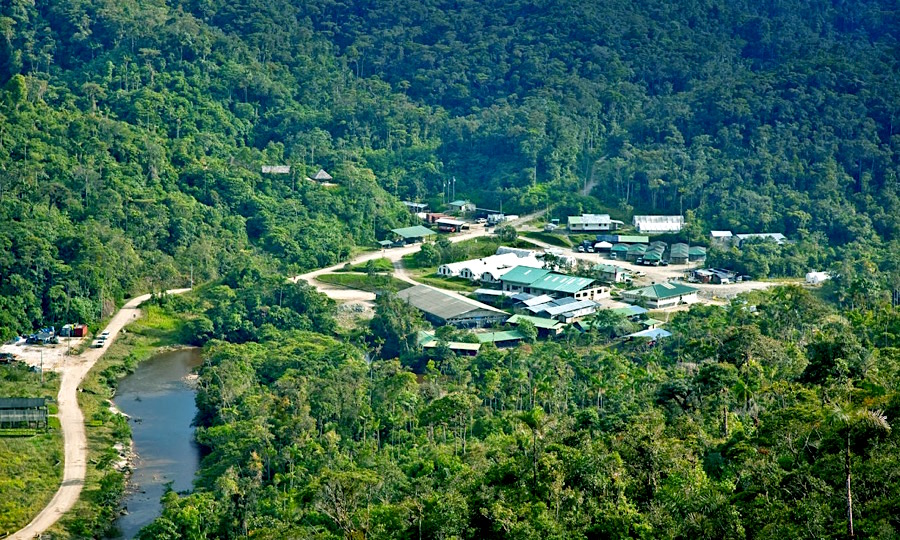
Haib is a porphyry copper exploration project located in the Karas Region of southern Namibia approximately six kilometres north of the border with South Africa and between 12km and 15km east of the tarred B1 highway that connects Namibia with South Africa. Koryx Copper Inc. has a 100% interest in Deep South Mining Company (Pty) Ltd., a Namibian subsidiary which in turn has a 100% interest in Haib Minerals (Pty) Ltd (“Haib Minerals”) which holds the exploration rights to the Haib Project. Exclusive Prospecting Licence 3140 (“EPL 3140”) allows for the exploration of base, rare and precious metals over an area of 36,589 hectares.
Results of PEA Financial Evaluation
A PEA financial model was developed from the updated studies with the following techno-economic results.
| Table 1: PEA Financial Valuation Results | |||||
| US$9,500/t | US$10,000/t | ||||
| Units | Pre-Tax | Post-Tax | Pre-Tax | Post-Tax | |
| NPV8% | US$m | 2,358 | 1,351 | 2,986 | 1,742 |
| IRR | % | 25.2% | 20.1% | 28.9% | 23.0% |
| Payback Period | years | 3.8 | 3.9 | 3.4 | 3.6 |
| LOM Cashflow | US$m | 6,557 | 4,084 | 7,948 | 4,944 |
| Upfront Capex 3 | US$m | 1,557 | |||
| Sustaining Capex 4 | US$m | 543 | |||
| Ave Annual Payable Cu Production | ktpa | 88 | LOM | ||
| C1 Cash Costs (Avg Years 1-10) 1 | US$/lb | 1.81 | Years 1 - 10 | ||
| AISC Costs (Avg Years 1-10) 2 | US$/lb | 2.05 | Years 1 - 10 | ||
| Capital Intensity | US$/t | 16,057 | Years 1 - 10 | ||
| Capital Intensity | US$/t | 16,740 | LOM | ||
| Table 2: Key Assumptions & Parameters | |||||||
| Mill/Float | Heap Leach | ||||||
| Item | Units | Total | M/F | H/L | |||
| Life of Mine | Years | 23 | |||||
| Copper price (base case) | US$/t | 9,500 | |||||
| Copper Recovery total | % | 84.2% | |||||
| Copper Recovery M/F | % | 88.8% | 88.8% | ||||
| Copper Recovery H/L | % | 77.7% | 77.7% | ||||
| Government Royalty (tax-deductable) | % | 3.0% | |||||
| Export Levy | % | 1.0% | |||||
| Table 3: LOM Production Parameters | |||||||
| Total | M/F | H/L | |||||
| Mineralised Material Tonnes Mined | Mt | 779 | |||||
| Mineralised Material Cu Grade Mined | % Cu | 0.309% | |||||
| Contained Copper Metal | kt | 2,405 | |||||
| Waste Tonnes Mined | Mt | 1,400 | |||||
| Strip Ratio | x | 1.80 | |||||
| Concentrate grade | % Cu | 21% | |||||
| LOM Copper in conc (Mill float) | kt | 1,842 | 1,842 | ||||
| LOM Copper cathode (Heap Leach) | kt | 257 | 257 | ||||
| LOM Payable Copper Production total | kt | 2,026 | |||||
| Avg payable Cu Production pa (first 10 years) | ktpa | 92 | Years 1 - 10 | ||||
| Avg payable Cu Production pa (LOM) | ktpa | 88 | LOM | ||||
| Table 4: Capital Cost Estimates | |||||||
| Capital Costs | Total | M/F | H/L | ||||
| Construction Capital (DRA Estimate) 3 | US$m | 968 | 808 | 159 | |||
| Capitalised Pre-strip | US$m | 33 | |||||
| Rail siding | US$m | 4 | |||||
| Mining capex | US$m | 29 | |||||
| Owners cost | US$m | 31 | |||||
| Surface infrastructure | US$m | 301 | |||||
| Site infrastructure | US$m | 52 | |||||
| Contingency | US$m | 139 | |||||
| Total Project Capital (incl. contingency) | US$m | 1,557 | |||||
| Sustaining Capital (LOM) 4 | US$m | 543 | 362 | 181 | |||
| Table 5: Unit Costs | |||||||
| Unit Costs per Tonne Mined/Processed | Total | M/F | H/L | ||||
| Mining Cost (per tonne mined) | US$/t | 2.15 | 2.15 | 2.15 | |||
| Variable Processing Cost (per t processed) | US$/t | 5.85 | 6.14 | 4.64 | |||
| Fixed Processing Cost (G&A) | US$m | 9.55 | 6.21 | 3.34 | |||
| Unit Costs per ton Payable Cu Produced | Total | M/F | H/L | ||||
| C1 Cash Costs (Avg Years 1-10) 1 | US$/t | 3,980 | 4,161 | 2,843 | |||
| C1 Cash Costs (Avg LOM) 1 | US$/t | 4,841 | 5,045 | 3,438 | |||
| All-in Sustaining Costs (Avg Years 1-10) 2 | US$/t | 4,519 | 4,708 | 3,332 | |||
| All-in Sustaining Costs (Avg LOM) 2 | US$/t | 5,415 | 5,629 | 3,944 | |||
| Unit Costs per lb Payable Cu Produced | Total | M/F | H/L | ||||
| C1 Cash Costs (Avg Years 1-10) 1 | US$/lb | 1.81 | 1.89 | 1.29 | |||
| C1 Cash Costs (Avg LOM) 1 | US$/lb | 2.20 | 2.29 | 1.56 | |||
| All-in Sustaining Cost (Avg Years 1-10) 2 | US$/lb | 2.05 | 2.14 | 1.51 | |||
| All-in Sustaining Costs (Avg LOM) 2 | US$/lb | 2.46 | 2.55 | 1.79 | |||
| Notes: | |||||||
| 1. C1 = Mining, processing plus on-site G&A and selling costs less by-product credits | |||||||
| 2. AISC = C1 costs plus royalties & levies and sustaining capex (excluding closure costs & reclamation value) | |||||||
| 3. Project Capital includes US$126m of EPCM costs | |||||||
| 4. Sustaining capital includes deferred capital for the TSF and HL/SX/EW plant, plus 0.75% of other project capital costs + US$50m in estimated closure costs - estimated salvage value | |||||||
Capital and Operating Cost Estimates
The capital cost estimate for the project was compiled by DRA, with inputs from Koryx and supporting specialist consultants KP and Qubeka.
The estimate for the main crushing, milling and flotation plant for higher grade (“HG”) mineralization was developed by DRA for a plant designed to process 28 Mtpa of ROM, with about 4 Mtpa of >150µm barren coarse particle flotation tailings being rejected ahead of conventional flotation of 24 Mtpa at a target grind of about 80% < 150µm.
The capital cost estimate for the 7 Mtpa low grade (“LG”) heap leach, copper solvent extraction and electrowinning and iron removal circuit was based on the estimates prepared by METS for the previous PEA of this project, updated by Koryx with input from DRA.
KP developed the capital cost estimates for the Tailings Storage Facility (“TSF”), access roads, water and bulk power supply, stormwater management, housing and site accommodation. DRA and Qubeka prepared estimates for infrastructure directly associated respectively with the process plants and contract mining area.
Each consultant submitted estimates of engineering, project and construction management (“EPCM”) services costs associated with their scope of work. This was supplemented by a detailed estimate by Koryx of Owner’s costs during project implementation.
The cost estimate for pre-strip of waste rock before commencing production mining operations was an outcome of Qubeka’s detailed mining schedules.
Significant portions of the heap leach/SX/EW, TSF and other infrastructure costs will only be incurred in the first or second year of operation, hence these were recorded as sustaining capital in the table below. Other sustaining capital costs in subsequent years of operation were estimated by DRA and KP.
Table 6: Project Capital Cost Breakdown (US$m)
| Item Description | UpfrontConstructionCapex | Heap Leach Capex (Y1 + Y2) | Sustaining Capex | Total Capex | |
| Mill float capital cost estimate | 737 | 0 | 89 | 826 | |
| HL/SX/EW capital cost estimate Y1 | 145 | 137 | 31 | 313 | |
| Tailings Facility | 30 | 0 | 200 | 230 | |
| Mining capex | 29 | 0 | 11 | 41 | |
| Owners cost | 31 | 0 | 0 | 31 | |
| Surface Infrastructure | 246 | 0 | 32 | 278 | |
| Site infrastructure | 50 | 0 | 0 | 50 | |
| EPCM Costs | 116 | 14 | 30 | 159 | |
| Total Capital Cost (excl. Contingency) | 1,385 | 151 | 393 | 1,929 | |
| Estimated 10% Contingency | 139 | 0 | 0 | 139 | |
| Capitalized Pre strip Mining | 35 | 0 | 0 | 35 | |
| Capex Total | 1,559 | 151 | 393 | 2,102 | |
Process plant operating cost estimates for the 28 Mtpa HG and 7 Mtpa LG plants were developed by DRA and Koryx, with associated labour rates and complements being prepared by Koryx. KP provided minor operating cost estimates for the related infrastructure. The process plants are expected to operate for 24 hours per day, 365 days per year.
Table 7: Project Operating Costs (US$/t processed)
| Cost Centre | 28 Mtpa High Grade Milling and Flotation Plant | 7 Mtpa Low Grade Heap Leach / SX EW Plant | ||||
| US$/t processed | US$m/year | US$/t processed | US$m/year | |||
| Material Handling Including Grade Control | 0.45 | 12.6 | 0.95 | 6.65 | ||
| Operating and Maintenance Labor | 0.44 | 12.32 | 0.53 | 3.71 | ||
| Power | 2.33 | 65.24 | 1.49 | 10.43 | ||
| Consumables and Reagents Including Water | 1.96 | 54.88 | 1.29 | 9.03 | ||
| Maintenance | 0.66 | 18.48 | 0.33 | 2.31 | ||
| Laboratory Analyses | 0.11 | 3.08 | 0.05 | 0.35 | ||
| Tailings Storage Facility | 0.19 | 5.32 | ||||
| MF Plant G&A Expenses | 0.22 | 6.16 | 0.48 | 3.34 | ||
| Total Variable and Fixed Processing Costs | 6.36 | 178.08 | 5.12 | 35.82 | ||
Mining operating costs were estimated by Qubeka based on the envisaged mining contractor’s selected equipment fleet and organisational structure. The estimate was done from first principles, using the original equipment manufacturers (“OEM”) hourly life cycle cost estimates with the simulated production rates for the primary mining equipment.
Site administration (G&A) costs were estimated by Koryx, based on other similar sized copper operations. The unit operating cost estimates thus derived are summarized in the table below:
Table 8: Total Operating Cost Estimate
| Cost Centre (average costs over life of mine) | Unit | Unit Cost | US$m/year | ||
| Waste Rock Mining | US$/t mined | 2.25 | 140.00 | ||
| Mineralized Mining | US$/t mined | 2.25 | 79.93 | ||
| MF Processing Plant | US$/t processed | 6.36 | 178.08 | ||
| HL Processing Plant | US$/t processed | 5.12 | 35.82 | ||
| Infrastructure Variable Costs | US$m/year | 8.52 | |||
| Non Process G&A Costs | US$m/year | 3.13 | |||
| Total Variable and Fixed Operating Costs | 445.48 | ||||
| Total Unit Operating Cost | US$/lb Cu | 2.26 | |||
Financial Sensitivity Analysis
Figure 1: Financial Sensitivity Spider Diagram
Table 9: IRR Sensitivity to Copper Price (Post-Tax)
Table 10: NPV8% Sensitivity Table (Post-Tax)
Geology and Mineralization
Haib is hosted within the coeval, Paleoproterozoic Orange River Group volcanic and Vioolsdrif Intrusive Suite of plutonic rocks of the Richtersveld Sub province of the Namaqua-Natal Province. The Orange River Group consists of several northwest trending felsic to mafic volcanic belts. The Vioolsdrif Intrusive Suite intrudes the Orange River Group and is composed of felsic to mafic batholiths dominantly composed of granodiorite.
At Haib the Vioolsdrif Intrusive Suite is made up of several phases of porphyritic intrusive rocks, including the main mineralized host rocks, termed the Quartz Feldspar Porphyry (QFP) and the Feldspar Porphyry (FP).
Figure 2: Haib Cu Project Geology & Drill Plan
The entire region has undergone two phases of greenschist facies metamorphism, which have mainly produced a metamorphic assemblage of chlorite-calcite-epidote-green biotite without significant deformation. Most of the rock exhibits typical porphyry copper type alteration zones associated with mineralization.
The higher-grade copper mineralization is controlled by a fracture / vein set that parallels a regional structural trend and strikes approximately northwest and dips steeply (-70°) to the southwest. This high-grade zone also appears to plunge at 30° to 40° towards the south-east.
Broad zones of copper mineralization occur over a strike length of approximately two kilometers that are commonly several hundreds of meters wide. Mineralization has been intersected by diamond drilling to a maximum depth of 790 m below the topographic surface. Copper mineralization is predominantly as chalcopyrite in both disseminated and vein form, however pyrite, minor bornite, chalcocite and molybdenite also occur.
Mineral Resource Estimate
The Haib Mineral Resource estimate included information obtained from diamond drillholes completed between 1963 and 2024 with drilling comprising a total length of 78,934 m. In addition, one underground adit was channel sampled over a length of 126 m. The historical data was extensively validated, and all data collected by Rio Tinto Zinc (120 drillholes from 1972 to 1975), Great Fitzroy Mines (13 drillholes from 1995 to 1999) and Teck (32 drillholes in 2010) were accepted for use in the Mineral Resource estimate.
A summary of the Mineral Resource estimate is presented in the Table below.
Table 11: Mineral Resource Estimate for Haib (as at 01 September 2025 at a 0.15% Cu cut-off)
| Category | Type | Tonnes(Mt) | Cu Grade(%) | Mo Grade(ppm) | Cu Content(Mlbs) | Mo Content(Mlbs) | Cu Content(kt) | Mo Content(kt) |
| Measured | Oxide & Transitional (>0.15% Cu) | 0 | 0 | 0 | 0 | 0 | 0 | 0 |
| Low Grade (0.15 to 0.225% Cu) | 0 | 0 | 0 | 0 | 0 | 0 | 0 | |
| High grade (>0.225 % Cu) | 0 | 0 | 0 | 0 | 0 | 0 | 0 | |
| Total | 0 | 0 | 0 | 0 | 0 | 0 | 0 | |
| Indicated | Oxide & Transitional (>0.15% Cu) | 23.5 | 0.31 | 16 | 159 | 0.8 | 72 | 0.4 |
| Low Grade (0.15 to 0.225 % Cu) | 45.3 | 0.21 | 46 | 211 | 4.6 | 96 | 2.1 | |
| High grade (>0.225 % Cu) | 442.3 | 0.34 | 53 | 3307 | 51.7 | 1500 | 23.5 | |
| Total | 511.0 | 0.33 | 51 | 3678 | 57.1 | 1668 | 25.9 | |
| Measured & Indicated | Oxide & Transitional (>0.15% Cu) | 23.5 | 0.31 | 16 | 159 | 0.8 | 72 | 0.4 |
| Low Grade (0.15 to 0.225 % Cu) | 45.3 | 0.21 | 46 | 211 | 4.6 | 96 | 2.1 | |
| High grade (>0.225 % Cu) | 442.3 | 0.34 | 53 | 3307 | 51.7 | 1500 | 23.5 | |
| Total | 511.0 | 0.33 | 51 | 3678 | 57.1 | 1668 | 25.9 | |
| Inferred | Oxide & Transitional (>0.15% Cu) | 16.3 | 0.28 | 16 | 102 | 0.6 | 46 | 0.3 |
| Low Grade (0.15 to 0.225 % Cu) | 37.7 | 0.21 | 45 | 175 | 3.8 | 79 | 1.7 | |
| High grade (>0.225 % Cu) | 254.8 | 0.32 | 41 | 1816 | 23.0 | 824 | 10.5 | |
| Total | 308.9 | 0.31 | 40 | 2093 | 27.4 | 949 | 12.4 |
Notes:
Samples from two drilling campaigns (King Resources and Falconbridge) comprising a total of 29 drillholes completed during the period 1963 to1969 were excluded from grade estimation as MSA was unable to satisfactorily validate these data. Koryx drilled 45 NQ size holes from 2021 to 2024, which verified the nature of the mineralisation in the historical database and infilled the drilling grid along the main mineralisation trend.
The pre-Teck and Koryx holes were largely drilled vertically and at a grid spacing of approximately 150 m. Teck and Koryx drilled angled holes, in some cases from the same location, to more optimally intersect the dipping mineralisation. Given the more targeted infill nature of the drilling and the challenging topography, the resultant grid is irregular.
Three-dimensional copper and molybdenum mineralisation models were created, and grades were estimated using the accepted historical and all Koryx data. Grade estimation of a three-dimensional block model was performed by ordinary kriging of two metre composite sample grades using Leapfrog Edge software. An average in-situ dry bulk density value of 2.78 t/m3 was assigned to all blocks.
This updated Mineral Resource Statement, with an effective date of 01 September 2025, represents re-reporting of the 2024 Mineral Resource model based on a revised optimised pit shell using parameters aligned with the 2025 Preliminary Economic Assessment. Molybdenum has been included in this update following metallurgical test-work allowing for assumed recovery to be applied.
The Mineral Resource was estimated using the Canadian Institute of Mining, Metallurgy and Petroleum (CIM) Best Practice Guidelines and is reported in accordance with the 2014 CIM Definition Standards, which have been incorporated by reference into National Instrument 43-101 – Standards of Disclosure for Mineral Projects (NI 43-101).
Pit Optimization and Mine Planning
The PEA envisages an open-pit mining operation with flotation of sulphide mineralization with a grade of greater than 0.225% copper, and heap leach with solvent extraction electro winning (SX-EW) of oxide and transitional mineralization with a grade greater than 0.15% Cu and low grade (0.15% Cu to 0.225% Cu) sulphide mineralization.
The optimised pit shell only considered mineralization contained within the modelled 0.20% Cu grade shell. While it is recognised that significant quantities of generally lower grade material exist outside the grade shell, this is for the time being not being included in the PEA mine schedule and has not been included in this Mineral Resource statement.
From the assumed parameters, a 0.1% Cu in-situ cut-off grade was calculated, which, together with the optimised pit shell demonstrates reasonable prospects for eventual economic extraction (RPEEE) for the Mineral Resource. The assessment to satisfy the criteria of RPEEE is a high-level estimate and is not an attempt to estimate Mineral Reserves. The Haib RPEEE pit shell is illustrated together with the block model in the Figures below.
An optimisation and mining study was completed by Qubeka and notes that the PEA is preliminary in nature and is based on Indicated and Inferred Mineral Resources that are considered too speculative geologically to have the economic considerations applied to them that would enable them to be categorised as Mineral Reserves. Inferred Mineral Resources were included in the pit optimisation runs and also classified as mineralized material during the LOM production schedule runs.
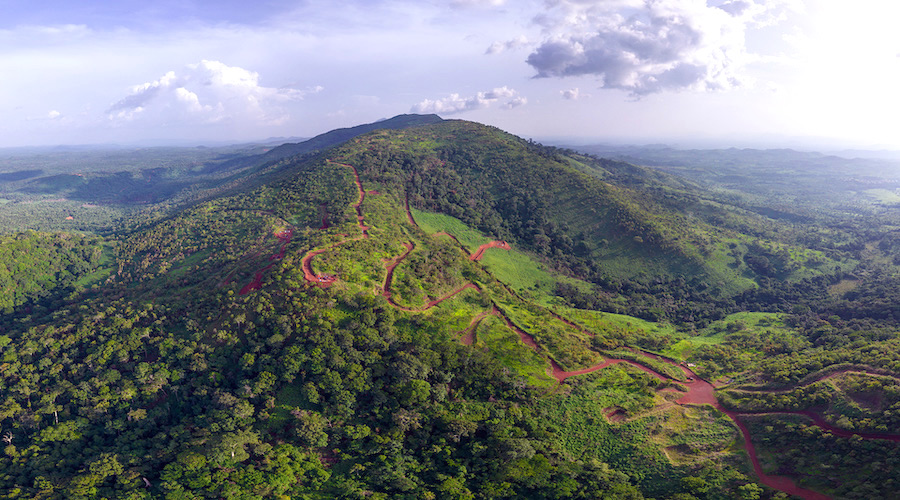
The deposit is a large copper-molybdenum porphyry deposit in southern Namibia amenable to open-pit mining. The mineralization will be mined as a conventional shovel and truck operation, with bulk mining augmented by more selective mining in areas with narrow mineralized material zones.
Figure 3: Haib resource pit shell and block model – plan view
Figure 4: Haib resource pit shell and block model –oblique view to the northIt was assumed that mining would take place by conventional open-pit methods and that the whole mining operation, except for the mine technical services function, would be outsourced to a reputable mining contractor company.
Figure 5: Ultimate Pit Design Layout (Plan View)
Figure 6: Ultimate Pt Design & Dimensions
Mine feed and waste will be loaded with hydraulic face shovels and hauled by diesel-powered trucks to the primary crusher, ROM pad stockpiles, low-grade stockpiles or waste rock dumps. The remainder of the mining production fleet consists of support equipment, including graders, track and wheel dozers, front-end loaders, rock breakers, and utility excavators.
The pit design and scheduling have been undertaken to allow for interim pushbacks, which will be mined early, thereby allowing higher grade to the plant to be maximised in the early years, and waste stripping deferred as far as possible into the future.
The Table below summarises the pit inventory at a cut-off grade of 0.150% Cu, with modified Indicated and Inferred material being classified as mineralized material.
Table 14 : Pit inventory at a cut-off grade of 0.150 %Cu (Indicated and Inferred Material)
| Production Parameter | Units | Total | |
| Milling Flotation (> 0.225 %Cu) Fresh Material | Mt | 626.81 | |
| Indicated Material | Mt | 406.63 | |
| Inferred Material | Mt | 220.18 | |
| Milling Flotation (> 0.225 %Cu) Fresh Material | Mt | 626.81 | |
| Heap Leach (0.150 - 0.225 %Cu) Fresh Material | Mt | 93.97 | |
| Indicated Material | Mt | 51.78 | |
| Inferred Material | Mt | 42.19 | |
| Heap Leach (0.150 - 0.225 %Cu) Fresh Material | Mt | 93.97 | |
| Oxide Material | Mt | 19.12 | |
| Transitional Material | Mt | 18.92 | |
| Heap Leach (> 0.150 %Cu) Oxide & Transitional Material | Mt | 38.07 | |
| Indicated Material | Mt | 22.64 | |
| Inferred Material | Mt | 15.44 | |
| Heap Leach (> 0.150 %Cu) Oxide & Transitional Material | Mt | 38.07 | |
| Waste | Mt | 1 425.26 | |
| Total Material Mined | Mt | 2 184.11 | |
| Strip Ratio [(Mineralized Waste + Waste) : Mineralization (ML & HL)] | Ratio | 1.88 | |
| Grade - Cu - Milling Flotation > 0.225 %Cu) Fresh Material | %Cu | 0.33% | |
| Grade - Cu - Heap Leach (0.150 - 0.225 %Cu) Fresh Material | %Cu | 0.20% | |
| Grade - Cu - Heap Leach (> 0.150 %Cu) Oxide & Transitional Material | %Cu | 0.29% | |
| Grade - Cu | %Cu | 0.31% | |
The final Haib copper mine production schedule was produced with a maximum material movement of approximately 120 Mtpa, providing approximately 23 years supply of mineralized material to the two envisaged processing routes.
The diagrams below summarize the mining material flows, production schedules and key mine mining and processing metrics for the proposed Haib open pit copper mine.
Figure 7: Material Mined per Annum by Material Type & Strip Ratio
Figure 8: Material Mined Annum per Pushback (PB)
Figure 9: Mill & Float Plant Feed Schedule
Figure 10: Heap Leach Plant Feed Schedule
Figure 11: Annual Equivalent Copper Production
The pre-strip period is six months, with a total of 19.9 Mt mined from the first two pushbacks. After the pre-strip period, the mineralized inventory on the grade control and ROM stockpiles is 6.14 Mt of material destined for the milling and flotation plant. The plant production ramp-up is twelve months after commissioning.
Mineral Processing
The following two processing routes are envisaged for the Haib project:
Metallurgical Test work
Mineralogical evaluation of the Haib deposit extends back to 1975. The most recent scanning electron microscopy (SEM) analyses of samples compiled by Koryx from drill cores in 2024 and 2025 determined the following mineralogical features of the deposit:
The samples tested in 2025 exhibited the following range of chemical analyses:
Comprehensive metallurgical tests have been undertaken since the mid 1990s. The following unit processes for treatment of sulfide minerals were investigated before Koryx became involved in the project:
In 1996, minerals processing tests culminated in collection of a bulk mineralized sample from an adit within the planned open pit perimeter and a small-scale pilot plant test of the milling and copper flotation steps.
In 2024 and 2025, Koryx commissioned the following additional tests:
Koryx has continued to work with GeoLabs, Maelgwyn, SGS, Eriez, Metso, RADOS, TOMRA, NextOre, Mintek and Ceibo to carry out the tests, and DRA and MJOI have continued to assist Koryx to interpret the test results.Generally, the comminution and flotation results produced during the current test program have been excellent and matched or exceeded the results of the historical programs completed by Mintek in 1996.
Initial column leach results look promising, but it is too early to confirm if previous expectations have been achieved or exceeded. Specifically, the following results have been generated:
Site Infrastructure
The site layout was updated during the PEA studies, including positioning the metallurgical plant in the optimal position for crushing and feeding rock mined from the pit. The current plant position makes use of the lowest haulage elevation, as well as open flat areas in the downstream part of the Volstruis valley.
Figure 12: Site Infrastructure Layout
Waste rock dumps were positioned in easily accessible areas to the north and south of the pit using the nearby valley fills, and tailings storage locations are connected to via slurry pipelines from the plant. The project can be accessed via the nearby asphalted B1 highway via a sealed access road which makes use of the shallow gradient created by the Haib River valley.
A water pipeline connects the plant with the abstraction point on the Orange River near to the town of Noordoewer, and powerlines access the plant area from the north where they connect locally with the NamPower 220kV national grid and mine site PV plant in the northwest of the proposed mine licence area.
Process Plant Design
The test work results summarised above as well as the conclusions of several trade-off studies have enabled Koryx and DRA to continue developing the base case process flowsheets for both high grade (HG) and low grade (LG) mineralized material.
The following trade-off studies have been completed by Koryx and its main specialist engineering consultants, specifically Qubeka, DRA and KP:
Figure 13: Isometric view of processing plant and mine infrastructure layout
Process Flow Sheet
The base case 28 Mtpa MF flowsheet for the PEA, based on the trade-off outcomes, is highlighted in the Figure below. The proposed flowsheet incorporates the following steps:
Figure 14: Haib Project plant process flowsheet
The heap leach (HL) plant has been sized to process 7 Mtpa of ROM feed to match the steady state mining production rate of 35 Mtpa to be processed in total in the MF and HL plants. This circuit will treat the lower grade sulfide material containing approximately 0.15% to 0.25% Cu and oxides of any grade to produce Grade A copper cathode product (99.995% Cu) that will be trucked, railed and shipped to international customers.
The HL plant flowsheet includes the following features:
The heap leach process presented in this PEA Technical Report has primarily been based by Koryx on historical metallurgical test work conducted by previous developers of the project. the design closely follows the conditions and configuration outlined in the 2021 PEA, with additional input and benchmarked information provided by DRA and MJOI. This approach leverages the design parameters established in preceding studies on the Haib Project, pending the completion of additional hydrometallurgical test work currently underway at Mintek under the direction of Koryx and MJOI.
Several copper producers or technology developers have been working on heap leach technology intended specifically for processing of low-grade chalcopyrite mineralization. After consideration of published information, Koryx elected to retain the Mintek Bacterial Heap Leach Process as one of the main options for heap leaching to be tested in 2025. This is the process that was tested in 2020 and included in the 2021 PEA of this Project. The 2020/2021 design and cost estimate basis have been used in this PEA to define the proposed 7 Mtpa heap leach process.
Mintek has done more development work on similar projects since 2020 and Koryx has commissioned additional Haib test work that is currently in process at Mintek, to evaluate potential improvements. Mintek’s process was developed specifically for chalcopyrite mineralization leaching. It has been tested on demonstration plant scale in 20,000 tonne heaps at an Iranian operation. Bacteria capable of operating at different temperature ranges are normally nurtured and then introduced to the heap leach. The process then operates at about 50 ºC and relies partly on heat retention in the heaps by balancing the irrigation and aeration flows to raise and maintain the in-heap temperatures sufficiently to achieve economic chalcopyrite leaching kinetics.
There needs to be enough pyrite in the mineralization to fuel the temperature increase. In addition to heat retention, a practical operation also requires control of heap pH below 2 to 3 and control of the ferric ion concentration of the leach solution to act as an oxidant and sustain bacterial activity. The management of solution flows (switching between raffinate and intermediate leach solution (ILS) for irrigation, and routing drainages to either pregnant or ILS pond), and correct start-up of the heap to initiate bacterial action and heat generation are also important elements of a successful operation.
Another copper project in Namibia has recently reported successful testing of a chloride heap leach process at Mintek. The technical consultant used was MJO Ingeniería y Consultores en Metalurgia (MJOI) based in Santiago, Chile. Koryx has retained MJOI to assist with definition and monitoring of the Haib bacterial leach tests at Mintek and to also specify three different chloride leach column tests at Mintek to be completed in parallel with the bacterial heap leach column test over approximately the next twelve months.
Trade-off Analyses
An overall summary of the options and permutations that were considered for the concentrator PEA flowsheet trade-offs is presented in the Figure below.
Figure 15: Trade-off Analyses Variations Considered
Mine Power Supply
A trade off study was completed to assess different connection and supply alternatives to meet the Project estimated peak power demand of 150 MVA and annual consumption of 1,124 GWh. A hybrid solution combining solar photovoltaic (PV) system and grid supply via the NamPower Harib substation to a new Haib substation was retained for the PEA. The recommended grid supply is to be via a double circuit overhead transmission line (OHTL) configuration for redundancy.
The on-site power infrastructure includes a metering station at the boundary of the mining area to provide NamPower access, while the main substation is located next to the main loads at the processing plant, in the centre of the mine area to reduce energy loss.
It is anticipated that deep connection upgrades will be required on NamPower network upstream of the Harib substation as well as shallow connection upgrades from Harib to the mine site. A grid connection study by NamPower is ongoing to confirm actual upgrades requirements and available preliminary information was used for the PEA. It is assumed that connection will be a Project cost, with the completed infrastructure to be handed back to NamPower.
Alternative energy supply sources were investigated in the trade-off study, including Solar PV and additional battery energy storage system (BESS). These were evaluated for both a 30% and 100% power supply options, subject to regulatory approval. The Namibian Electrical Control Board (ECB) currently allow for up to 30% power supply from alternative source which was retained for the PEA with potential to revisit in future study upgrade. The 30% limit can be increased by application for specific projects, and a 100% potential supply from Solar PV system however provides an important advantage to lower power cost.
Different ownership models were considered including full ownership and purchase agreements with independent power producers (IPP). An IPP purchase agreement was selected for the PEA. On site back up system such as diesel generator at the Haib substation and key areas.
Water supply strategy and off channel storage dam
A water supply alternative assessment was completed to compare various sources of water and considered conveying water from a desalination plant at the coast near Oranjemund, from Naute Dam, from Neckartal Dam and from the nearby Orange River and from local groundwater sources.
Sourcing water from the transboundary Orange River showed as a preferred source of water when combined with off-channel storage to withstand extended periods of droughts and/or low flows in the Orange River and to avoid adverse impacts on downstream users. To meet the Project water demand preliminarily estimated at 20 million cubic metres per annum, abstracting water from the Orange River requires an abstraction weir to be constructed across the river with an intake structure designed to minimise sediment intake. Various possible weir locations were assessed and a site near the town of Noordoewer outside of existing and future water infrastructure was selected as a preferred option. Specialist hydrology and water balancing studies were completed to assess the Orange River yield and release potential through various operating and climatic conditions in order to size the abstraction volumes and that of the off-channel storage for the Project.
The proposed system comprises an abstraction weir, intake structure, a low-lift and two high-lift booster pumping stations, and a steel pipeline delivering water to a terminal reservoir and off-channel storage dam at the mine. This supply system assumes that the pumping scheme will have capacity to abstract and transfer water at higher rates during high flow periods when the Orange River system experiences a surplus, whilst water stored on site will be used when the river experiences lower flows. This requires a sizable off-channel storage dam.
Koryx will continue to assess the water supply options during the PFS studies, including a pipeline connection with the Neckartal Dam 260km to the north for a potential hybrid scheme, allowing water to be sourced from either the river or the dam.
Tailings Facility Options Trade off Study
The Project mining schedule shows that approximately 626 million tonnes of tailings will be generated through the life of mine. A high level siting study and trade off analysis completed by Knight Piésold identified five potential TSF location in the EPL area. The base assumption was to use thickened slurry tailings pumped to the TSF.
The TSF models were compared in terms of embankment construction volumes, footprint area, starter embankment requirements, distance to plant, geotechnical risks, environmental impact, and final height. TSF 5 scored the highest as a most storage effective structure with capacity to store all tailings. The study resulted in TSF 3, close to the Open Pit and northern Waste Rock Dump (WRD), and TSF 5 being retained for the PEA design and cost estimate and can jointly store all tailings storage requirement.
The starter embankments were sized to accommodate approximately 20 months of tailings storage as well as required freeboard for storm events. The embankment comprises an earthfill zone sourced from borrow, filter zone, chimney drain and upstream zone with a lined face tied into the foundation to reduce potential seepage through the dam wall. It is envisaged that the downstream portion of the embankment will be constructed of waste rock. The configuration also includes an underdrainage system and downstream seepage cut off trench to collect and reuse seepage water. TSF 5 embankment is contained within the valley and to be raised downstream for most of its life cycle followed by final centre raises. TSF 3 will use an initial downstream raise, centre raises and a final upstream raise to contain all storage requirement. TSF 5 can store up to 515 million tonnes of tailings, and TSF 3 approximately 110 million tonnes of tailings.
The water management system comprises of a pumping station set on a floating barge linked to a decant causeway. Further trade off studies to consider interim pumping stations in decant towers are also considered for the next design stage. The design basis was developed for the proposed operations using Global Industry Standard on Tailings Management (GISTM) from 2020 to assess the dam classification of the TSF based on the consequence of a hypothetical dam failure.
Mine Access Road
The Project can be accessed from Windhoek or Noordoewer through the B1 National Highway and sets of farm roads and tracks developed during exploration programs. Different access roads were investigated during the conceptual design stage, and the access going along the Haib River bank was rated most favourable in terms of geometrics, gradients, and cut and fill material balance. A key limiting factor from the route going through the plateau is the steep terrain incline, hard rock excavation limiting side hill cuts, and rugged topography to access processing facilities with larger and heavier traffic. However, the route going through the Haib River basin will require further hydrological and engineering mitigation to manage extreme flood events, such as additional fill, river/flood plain crossing/drifts, and sidehill erosion protection/flood mitigation.
Based on the capital cost, maintenance costs, ease of construction, dust mitigation, and visual aesthetics, a sealed road option is recommended for the mine access road for use on all haul vehicles, buses, and general vehicles. A gravel wearing course and dump rock pavement layer with a dust suppressant is recommended for the haul road section between the open pit and processing stockpiles as well as to the waste rock dumps to lower dust emission, wear, and damage to the road surface.
Mine Housing
The conceptual studies developed for the PEA compared different on-site and off-site accommodation packages. On-site accommodation for the Project workforce was selected as the preferred option for the PEA to minimize impacts on the community during construction and operation.
The mining camp and associated infrastructures were placed north of the main mining activities on flatter ground near the Project access road and solar power plant. The design includes workers’ accommodation, multi-purpose warehouses, gravity-fed water and sewer system, power supply and associated infrastructure services to ensure functionality. Prefabricated housing units were used for the preliminary cost estimates with an assumption that the units could be used during operation.
Environmental and Permitting
A comprehensive Environmental and Social Impact Assessment (ESIA) with associated Environmental and Social Management Plan (ESMP) and public consultations is currently being undertaken and developed to both Namibian national requirements and to International Finance Corporation (IFC) standards. The ESIA is being prepared to obtain an Environmental Clearance Certificate (ECC) for the project from Namibian authorities.
The ECC application is planned to be submitted to Namibian authorities in early 2026 once detail from the pre-feasibility study (PFS) level assessments have been included. The Project will be subject to national review and a number of environmental and social conditions stipulating preventative and mitigative measures that will be mandated before the project proceeds.
Baseline studies to support the ESIA process were initiated in 2023 and are ongoing with terrestrial biodiversity, aquatic biodiversity, water resource and water demand impact and archaeological studies near completion and geochemistry, hydrogeology, air quality and background noise well advanced. Additional baseline studies set to commence in September 2025 include a second round of terrestrial biodiversity and socio economics. A routine monitoring program focusing on surface water, groundwater and air is ongoing. Early inputs into defining the biophysical and social baseline were intentional to ensure the facility design process, including trade off studies and concept designs, were informed towards avoidance of potential impacts at early design phase.
The Project initiated stakeholder engagement in 2023 starting with regulators and moving towards broader stakeholders through 2025. These engagements mapped out potential Interested and Affected Persons (I&APs) and commenced with introductory discussions with stakeholders associated with the towns of Noordoewer and Aussenkehr. The regulatory public participation process (PPP), as required by Namibian regulations and IFC performance standards, was initiated in July 2025. Stakeholder perception of the Project at this early stage is generally positive with interest being placed on job creation, broader economic development and opportunity, and community and infrastructure development.
Risks and Opportunities
Opportunities
Risks
Presentation & Investor Webinar
Koryx Copper will host a live webinar call to discuss the updated PEA report. Participants must register for the event beforehand using the link below.
Date & Time: Friday, September 5, 2025 at 10:00am ETRegistration Link: https://us06web.zoom.us/webinar/register/WN_qUZaHmJdTTyMb21V_tNvlw
Please Join the Koryx management team for the discussion. The webinar will include a formal presentation followed by a Q&A session.
Quality Control
All drill core was logged, photographed, and split with a diamond saw. Half of the core was bagged and sent to ALS Laboratories Ltd. in Johannesburg, South Africa for analysis (SANAS Accredited Testing Laboratory, No. T0387) and ActLabs in Canada, while the other half was quartered with one quarter archived and stored on site for verification and reference purposes while the other quarter will be used for metallurgical test work. 33 elements are analyzed by Induced Coupled Plasma (ICP) utilizing a 4-acid digestion and gold is assayed for using a 30g fire assay method. Duplicate samples, blanks, and certified standards are included with every batch and are actively used to ensure proper quality assurance and quality control (“QA/QC”) The QA/QC frequency is 1 in 20 for each of blanks, duplicates and standards.
Qualified Persons
The Qualified Person for the Mineral Resource estimate is Mr. Jeremy C. Witley (BSc Hons, MSc (Eng.)) and he has reviewed and approved the scientific and technical information in this news release. Mr. Witley is a geologist with more than 35 years’ experience in base and precious metals exploration and mining as well as mineral resource evaluation and reporting. He is Head of Mineral Resources for The MSA Group, is independent of the Company and its mineral properties (an independent consulting company), is registered with the South African Council for Natural Scientific Professions (SACNASP) and is a Fellow of the Geological Society of South Africa (GSSA). Mr. Witley has the appropriate relevant qualifications and experience to be considered a “Qualified Person” for the style and type of mineralization and activity being undertaken as defined in National Instrument 43-101 Standards of Disclosure of Mineral Projects.
Mr. Werner Moeller is a Director and Principal Mining Engineering Consultant of Qubeka Mining Consultants CC based in Windhoek, Namibia and has reviewed and approved the scientific and technical information in this news release. He holds a BEng degree in Mining Engineering and a BEng (Hons) degree in Industrial Engineering from the University of Pretoria (South Africa). He is a Fellow of the Australian Institute of Mining and Metallurgy (membership number 329888) and a Member of the South African Institute of Mining and Metallurgy (membership number 704793). Mr. Moeller has been practicing his profession continuously since 2002 and has 22 years of mine planning and operations experience across a range of African projects. Mr. Moeller is independent of the Company and its mineral properties and is a Qualified Person for the purposes of National Instrument 43-101.About Koryx Copper Inc.
Koryx Copper Inc. is a Canadian copper development Company focused on advancing the 100% owned Haib Copper Project in Namibia whilst also building a portfolio of copper exploration licenses in Zambia. Haib is a large, advanced (PEA-stage) copper/molybdenum porphyry deposit in southern Namibia with a long history of exploration and project development by multiple operators. More than 80,000m of drilling has been conducted at Haib since the 1970’s with significant exploration programs led by companies including Falconbridge (1964), Rio Tinto (1975) and Teck (2014). Extensive metallurgical testing and various technical studies have also been completed at Haib to date.
Additional studies are underway aiming to demonstrate Haib as a future long-life, low-cost, low-risk open pit, sulfide flotation copper project with the potential for additional copper production from heap leaching. Haib has a current mineral resource of 414Mt @ 0.35% Cu for 1,459Mt of contained copper in the Indicated category and 345Mt @ 0.33% Cu for 1136Mt of contained copper in the Inferred category (0.25% Cu cut-off).
Mineralization at Haib is typical of a porphyry copper deposit and it is one of only a few examples of a Paleoproterozoic porphyry copper deposit in the world and one of only two in southern Africa (both in Namibia). Due to its age, the deposit has been subjected to multiple metamorphic and deformation events but still retains many of the classic mineralization and alteration features typical of these deposits. The mineralization is dominantly chalcopyrite with minor bornite and chalcocite present and only minor secondary copper minerals at surface due to the arid environment.
Further details of the Haib Copper Project are available in the corresponding technical report titled, "NI 43-101 Technical Report – August 2024 Mineral Resource Estimate for the Haib Copper Project, Namibia" dated effective August 31, 2024 (the "Technical Report"). The Technical Report and other information is available on the Company's website at https://koryxcopper.com and under the Company's profile on SEDAR+ at www.sedarplus.ca.
ON BEHALF OF THE BOARD OF DIRECTORS"Heye Daun"President, CEO and Director
Additional information is also available by contacting the Company:
Julia Becker Corporate Communications [email protected]+1-604-785-0850Neither the TSX Venture Exchange nor its Regulation Services Provider (as that term is defined in the policies of the TSX Venture Exchange) accepts responsibility for the adequacy or accuracy of this release.
Cautionary Statement Regarding Forward-Looking Information
This press release contains "forward-looking information" within the meaning of applicable Canadian securities legislation. Forward-looking information includes, without limitation, statements regarding the use of proceeds from the Company's recently completed financings and the future or prospects of the Company. Generally, forward-looking information can be identified by the use of forward-looking terminology such as "plans", "expects" or "does not expect ", "is expected ", "budget", "scheduled", "estimates", "forecasts", "intends", "anticipates" or "does not anticipate", or "believes", or variations of such words and phrases or state that certain actions, events or results "may", "could", "would", "might" or "will be taken", "occur" or "be achieved". Forward-looking statements are necessarily based upon a number of assumptions that, while considered reasonable by management, are inherently subject to business, market, and economic risks, uncertainties, and contingencies that may cause actual results, performance, or achievements to be materially different from those expressed or implied by forward-looking statements. Although the Company has attempted to identify important factors that could cause actual results to differ materially from those contained in forward-looking information, other factors may cause results not to be as anticipated, estimated, or intended. There can be no assurance that such information will prove to be accurate, as actual results and future events could differ materially from those anticipated in such statements. Accordingly, readers should not place undue reliance on forward-looking information. Other factors which could materially affect such forward-looking information are described in the risk factors in the Company's most recent annual management discussion and analysis. The Company does not undertake to update any forward-looking information, except in accordance with applicable securities laws.
Images accompanying this announcement are available at
https://www.globenewswire.com/NewsRoom/AttachmentNg/d53f4ddb-d66d-4da9-a03b-bb8b2d4cb234
https://www.globenewswire.com/NewsRoom/AttachmentNg/a1f909f4-c19c-40c4-a890-f45a73f0cc05
https://www.globenewswire.com/NewsRoom/AttachmentNg/51557f98-7934-497f-8845-2c310ab22a7d
https://www.globenewswire.com/NewsRoom/AttachmentNg/8dc0d991-f300-4078-9f87-304b0e084dfc
https://www.globenewswire.com/NewsRoom/AttachmentNg/f0d25e2e-8823-4b8c-9cf4-057fbefbabe3
https://www.globenewswire.com/NewsRoom/AttachmentNg/7fd99f3d-517d-4666-90b8-14a38cf8237e
https://www.globenewswire.com/NewsRoom/AttachmentNg/e95cf074-9319-42e4-a84c-71320e112fdb
https://www.globenewswire.com/NewsRoom/AttachmentNg/8d2c228e-3e06-4bc2-bd46-fe20131e5587
https://www.globenewswire.com/NewsRoom/AttachmentNg/ffc6660a-ee94-4312-aba1-de59f60db983
https://www.globenewswire.com/NewsRoom/AttachmentNg/b0bdd8a5-66cd-401c-bc5a-86447408cf68
https://www.globenewswire.com/NewsRoom/AttachmentNg/7a7d38c5-3777-4f43-a7f8-e4be163e92dd
https://www.globenewswire.com/NewsRoom/AttachmentNg/f8d4d99d-7db5-4dfc-93e5-fb7bcfae33a8
https://www.globenewswire.com/NewsRoom/AttachmentNg/e7535676-085e-4e52-8ad4-3ee240ec327d
https://www.globenewswire.com/NewsRoom/AttachmentNg/3347b454-1c74-4800-83a4-ce93e31946f9
https://www.globenewswire.com/NewsRoom/AttachmentNg/4c66cf1f-545b-4dc7-b3ad-36ee3b37a32c
https://www.globenewswire.com/NewsRoom/AttachmentNg/e84044ba-a2ea-480b-9d01-ce2ebe55e1f8
https://www.globenewswire.com/NewsRoom/AttachmentNg/0c84f910-2609-46e3-974b-77c90e946213
https://www.globenewswire.com/NewsRoom/AttachmentNg/5f8acf61-7d15-4f4e-90c5-df71c4a063ff


The new Mining Power Rankings are live. Vote for the sector’s leaders in each of the Large-, Small-, and Micro-Cap leagues.