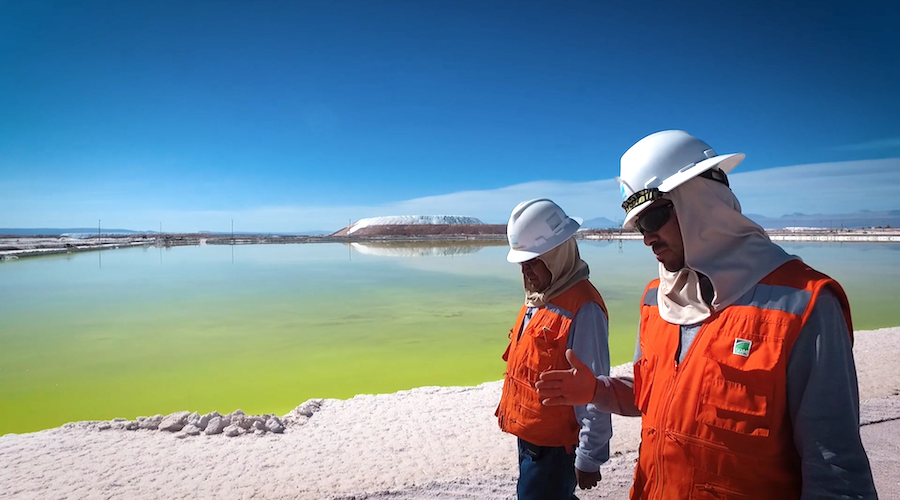
Codelco and SQM budget $3 billion for lithium project in Chile
Their Novandino Litio partnership set its latest projection after wrapping up design work.

Trading Symbol: TSX/NYSE AMERICAN: SVM
VANCOUVER, BC, May 26, 2026 /CNW/ - Silvercorp Metals Inc. ("Silvercorp" or the "Company") (TSX: SVM) (NYSE American: SVM) reported its financial and operating results for the three months ("Q4 Fiscal 2026") and twelve months ("Fiscal 2026") ended March 31, 2026. All amounts are expressed in US dollars, and figures may not add due to rounding.
HIGHLIGHTS FOR Q4 FISCAL 2026
______________________________ | |
1 | Non-GAAP measures, please refer to MD&A section 15 for reconciliation. |
HIGHLIGHTS FOR FISCAL 2026
CONSOLIDATED FINANCIAL AND OPERATING RESULTS
Three months ended March 31, | Years ended March 31, | ||||||
2026 | 2025 | Changes | 2026 | 2025 | Changes | ||
Financial Results (in thousands of $, except per share) | |||||||
Revenue | $ 147,359 | $ 75,113 | 96 % | $ 438,135 | $ 298,895 | 47 % | |
Mine operating earnings | 99,959 | 26,146 | 282 % | 253,708 | 123,551 | 105 % | |
Net loss* | (722) | (7,585) | (91) % | (9,944) | 58,190 | (117) % | |
Per share - basic | (0.003) | (0.03) | (91) % | (0.05) | 0.29 | (116) % | |
Adjusted earnings* | 59,255 | 14,747 | 302 % | 150,786 | 75,089 | 101 % | |
Per share - basic | 0.27 | 0.07 | 296 % | 0.69 | 0.37 | 87 % | |
EBITDA* | 38,887 | 9,680 | 302 % | 84,207 | 116,916 | (28) % | |
Per share | 0.18 | 0.04 | 296 % | 0.38 | 0.57 | (33) % | |
Adjusted EBITDA* | 98,102 | 29,764 | 230 % | 238,127 | 132,211 | 80 % | |
Per share | 0.44 | 0.14 | 225 % | 1.09 | 0.65 | 67 % | |
Cash flow from operating activities | 90,164 | 30,701 | 194 % | 310,568 | 138,631 | 124 % | |
Sustaining capital expenditures | 12,551 | 9,353 | 34 % | 49,067 | 43,931 | 12 % | |
Growth capital expenditures | 19,750 | 7,175 | 175 % | 80,186 | 35,871 | 124 % | |
Free cash flow | 57,863 | 14,174 | 308 % | 181,315 | 58,828 | 208 % | |
Basic weighted average shares outstanding | 220,862,813 | 217,452,033 | 1 % | 219,425,164 | 204,008,035 | 7 % | |
Metals sold | |||||||
Silver (million ounces) | 1.5 | 1.6 | (9) % | 6.8 | 6.9 | (2) % | |
Gold (ounces) | 2,623 | 3,465 | (24) % | 8,857 | 7,577 | 17 % | |
Lead (million pounds) | 13.6 | 16.3 | (17) % | 60.0 | 62.3 | (4) % | |
Zinc (million pounds) | 3.9 | 4.5 | (14) % | 21.7 | 23.5 | (7) % | |
Average Selling Price, Net of Value Added Tax and Smelter Charges | |||||||
Silver ($/ounce) | 78.56 | 27.78 | 183 % | 46.44 | 26.95 | 72 % | |
Gold ($/ounce) | 4,408 | 2,533 | 74 % | 3,556 | 2,351 | 51 % | |
Lead ($/pound) | 0.98 | 0.93 | 5 % | 0.96 | 0.96 | — % | |
Zinc ($/pound) | 1.25 | 1.06 | 18 % | 1.06 | 1.11 | (5) % | |
Cost Data per ounce of silver, net of by-product credits ($) | |||||||
Cash cost | (1.92) | 2.49 | (177) % | (0.94) | (0.54) | (74) % | |
All-in sustaining cost | 17.35 | 14.31 | 21 % | 14.25 | 12.12 | 18 % | |
Financial Position (in thousands of $) as at | March 31, 2026 | December 31,2025 | March 31, 2026 | March 31,2025 | |||
Cash and cash equivalents and short-term investments | $ 422,335 | $ 462,840 | (9) % | 422,335 | 462,840 | 14 % | |
Working capital | 319,461 | 94,573 | 238 % | 319,461 | 310,359 | 3 % | |
*Attributable to equity holders |
INDIVIDUAL MINE OPERATING PERFORMANCE
(i) Ying Mining District
Q4 Fiscal 2026
The Ying Mining District delivered a stable Q4 Fiscal 2026, with ore mined of 293,437 tonnes, up 43% over Q4 Fiscal 2025, driven by the increased use of shrinkage mining relative to cut-and-fill re-suing. Mill throughput was 311,677 tonnes, up 2% over Q4 Fiscal 2025.
Production was approximately 1.4 million ounces of silver, 2,492 ounces of gold, or 1.5 million ounces of silver equivalent, 12.9 million pounds of lead, and 1.4 million pounds of zinc, representing decreases of 11% in silver, 20% in gold, 18% in silver equivalent, 17% in lead and 30% in zinc, respectively, over Q4 Fiscal 2025. Lower metal production was due to lower head grades, as a result of higher dilution associated with an increase in more cost efficient shrinkage mining.
Cash cost per tonne of ore was $78.27 in Q4 Fiscal 2026, down 8% from Q4 Fiscal 2025 and below the lower end of Fiscal 2026 guidance of $86.8. The improvement reflects ongoing mine mechanization and the greater use of cost-efficient shrinkage mining versus labour intensive re-suing mining, boosting mine and mill productivity. Cash cost per ounce of silver, net of by-product credits, was negative $1.03, compared with $3.05 in Q4 Fiscal 2025, driven by the lower cost per tonne and an increase of $0.8 million in by-product credits from revenue of non-silver metals.
AISC per tonne of ore was up 11% in Q4 Fiscal 2026, to $134.23, remaining below the Fiscal 2026 guidance range of $157.8–$160.5. AISC per ounce of silver, net of by-product credits, was $13.09, delivering robust margins amid higher silver prices.
Fiscal 2026
In Fiscal 2026, the Ying Mining District mined approximately 1,211,916 tonnes of ore, up 18% over Fiscal 2025. Mill throughput was 1,188,459 tonnes, up 17% over Fiscal 2025.
Production was approximately 6.3 million ounces of silver, 8,723 ounces of gold, or 7.0 million ounces of silver equivalent, 55.1 million pounds of lead, and 6.6 million pounds of zinc, representing a production increase of 16% in gold and production decreases of 1% in silver, 1% in silver equivalent, 3% in lead and 23% in zinc compared to Fiscal 2025. Lower production was due to lower head grades, as a result of a higher dilution associated with an increase in shrinkage mining.
Cash cost per tonne of ore was $79.71 in Fiscal 2026, down 10% from Fiscal 2025 and below the lower end of Fiscal 2026 guidance of $86.8, mainly attributable to improved mining and milling productivity driven by increased underground mechanization. Cash cost per ounce of silver, net of by-product credits, was negative $0.01, compared with $0.62 in Fiscal 2025, driven by the lower cash cost per tonne and an increase of $10.0 million in by-product credits from revenue of non-silver metals.
AISC per tonne of ore improved 4% in Fiscal 2026, to $134.19, remaining below the Fiscal 2026 guidance range of $157.8–$160.5. AISC per ounce of silver, net of by-product credits, was $11.49.
Mining Permit Expansion Applications
As of March 31, 2026, the Company has completed the mining permits extension and mining capacity expansion for the four mining permits comprising the Ying Mining District, which are the SGX, TLP-LM, HPG, and DCG mining permits. The total mining capacity allowed by the mining permits is 1.32 million tonnes per year.
Mining permit | SGX | TLP-LM | HPG | DCG | Ying total |
Capacity (tonnes) | 500,000 p.a. | 600,000 p.a. | 120,000 p.a. | 100,000 p.a. | 1,320,000 p.a. |
Expiry dates | 9/24/2035 | 26/02/2041 | 29/04/2028 | 16/6/2037 |
Production Safety License Renewal
Following the grant of the new mining permits for SGX, TLP-LM, HPG, and DCG, the Company is working on the renewal of the required production safety licenses. At SGX, the safety facility design has been approved, and it is currently in the construction phase for the mine capacity expansion. At HPG, the safety facility design has been reviewed by the emergency management department of Henan Province, pending final signature. At TLP-LM and DCG, the safety facility designs have been completed and submitted to the emergency management department for approval.
Ying Mining District | Three months ended | Years ended March 31, | ||||||
March 31,2026 | December 31,2025 | September 30, 2025 | June 30, 2025 | March 31, 2025 | 2026 | 2025 | ||
Ore processed (tonnes) | ||||||||
Silver-lead ore | 279,627 | 299,217 | 235,168 | 252,958 | 265,199 | 1,066,970 | 927,171 | |
Gold ore | 32,050 | 29,208 | 29,834 | 30,397 | 39,025 | 121,489 | 86,488 | |
311,677 | 328,425 | 265,002 | 283,355 | 304,224 | 1,188,459 | 1,013,659 | ||
Average head grades for silver-lead ore | ||||||||
Silver (grams/tonne) | 161 | 190 | 207 | 217 | 198 | 193 | 225 | |
Lead (%) | 2.2 | 2.3 | 2.6 | 2.8 | 2.9 | 2.5 | 3.0 | |
Zinc (%) | 0.4 | 0.4 | 0.4 | 0.5 | 0.5 | 0.4 | 0.6 | |
Average head grades for gold-ore | ||||||||
Gold (grams/tonne) | 1.1 | 1.2 | 1.4 | 1.5 | 1.4 | 1.3 | 1.7 | |
Silver (grams/tonne) | 54 | 57 | 81 | 51 | 62 | 61 | 72 | |
Lead (%) | 0.9 | 1.1 | 0.9 | 0.8 | 0.7 | 0.9 | 0.9 | |
Recovery rates | ||||||||
Silver (%) | 95.0 | 95.3 | 94.8 | 94.6 | 94.2 | 95.4 | 94.7 | |
Gold (%)** | 90.8 | 92.8 | 94.2 | 93.4 | 91.7 | 92.7 | 92.9 | |
Lead (%) | 93.2 | 93.6 | 93.5 | 94.1 | 92.3 | 93.7 | 93.6 | |
Zinc (%) | 63.9 | 63.0 | 65.8 | 64.3 | 67.3 | 64.1 | 69.7 | |
Cash Costs | ||||||||
Cash cost ($/tonne) | 78.27 | 75.80 | 82.89 | 83.08 | 84.90 | 79.71 | 88.46 | |
AISC ($/tonne) | 134.23 | 134.06 | 139.22 | 129.83 | 120.62 | 134.19 | 139.33 | |
Cash cost, net of by-product credits ($/ounce of silver) | (1.03) | (1.22) | 0.97 | 1.26 | 3.05 | 0.01 | 0.62 | |
AISC, net of by-product credits ($/ounce of silver) | 13.09 | 11.32 | 11.75 | 10.10 | 11.35 | 11.49 | 9.68 | |
Metal Production | ||||||||
Silver (million ounces) | 1.4 | 1.7 | 1.5 | 1.7 | 1.6 | 6.3 | 6.4 | |
Gold (ounces) | 2,492 | 2,096 | 2,085 | 2,050 | 3,110 | 8,723 | 7,495 | |
Silver equivalent (million ounces) | 1.5 | 1.9 | 1.7 | 1.9 | 1.9 | 7.0 | 7.1 | |
Lead (million pounds) | 12.9 | 14.7 | 12.9 | 14.6 | 15.6 | 55.1 | 56.8 | |
Zinc (million pounds) | 1.4 | 1.9 | 1.4 | 1.8 | 2.0 | 6.6 | 8.6 | |
**Gold recovery only refers to the recovery rate for gold ore processed. | ||||||||
(ii) GC Mine
Q4 Fiscal 2026
The GC Mine produced approximately 0.1 million ounces of silver, 1.1 million pounds of lead, and 2.5 million pounds of zinc in Q4 Fiscal 2026, representing an increase of 3% in silver, 51% in lead and 4% in zinc over Q4 Fiscal 2025, primarily attributable to an increase in ore processed.
Cash cost per tonne of $71.12 and AISC per tonne of $109.68, and improved 8% and 7%, respectively, from Q4 Fiscal 2025, attributable to a lower unit overhead cost allocation with an increase of 24% in ore processed.
On a per ounce of silver, net of by-product credits basis, cash cost and AISC were negative $19.93 and $10.22, respectively, compared to negative $8.53 and $15.05 in Q4 Fiscal 2025. The improvement primarily reflects a $1.0 million increase in by-product credits.
Fiscal 2026
The GC Mine produced approximately 0.5 million ounces of silver, 5.2 million pounds of lead, and 15.1 million pounds of zinc in Fiscal 2026, representing an increase of 3% in zinc and decreases of 11% in silver and 2% in lead, compared to Fiscal 2025.
Cash cost per tonne of $60.08 and AISC per tonne of $87.48, and increased 9% and 5%, respectively, from Fiscal 2025, mainly due to a higher per tonne fixed costs allocation resulting from the decrease in ore production.
On a per ounce of silver, net of by-product credits basis, cash cost and AISC were negative $14.23 and $4.70, respectively, compared to negative $14.71 and $3.12 in Fiscal 2025.
GC Mine Classification Update
The Company has commissioned Changsha Mining Research Institute to prepare the development and utilization plan to change the GC's classification from a lead-zinc mine to a silver mine. GC has an annual production capacity of 300,000 tonnes, is considered a medium-scale operation and is limited to no more than three production levels operating simultaneously. Once classified as a silver mine, GC would be considered large-scale and would no longer be subject to this restriction.
GC Mine | Three months ended | Years ended March 31, | ||||||
March 31,2026 | December 31, 2025 | September 30, 2025 | June 30, 2025 | March 31,2025 | 2026 | 2025 | ||
Ore Production (tonne) | 48,840 | 87,095 | 76,249 | 74,869 | 41,760 | 287,053 | 299,036 | |
Head grades | ||||||||
Silver (grams/tonne) | 52 | 52 | 64 | 69 | 61 | 59 | 67 | |
Lead (%) | 0.9 | 1.0 | 0.9 | 0.8 | 0.9 | 0.9 | 0.9 | |
Zinc (%) | 2.6 | 2.9 | 2.8 | 2.3 | 2.9 | 2.7 | 2.5 | |
Recovery rates | ||||||||
Silver (%) | 86.3 | 85.9 | 85.8 | 85.3 | 83.7 | 85.7 | 83.1 | |
Lead (%) | 93.5 | 89.1 | 89.0 | 90.1 | 87.4 | 93.4 | 89.3 | |
Zinc (%) | 90.6 | 92.7 | 91.1 | 90.0 | 90.3 | 91.3 | 90.3 | |
Cash Costs | ||||||||
Cash cost ($/tonne) | 71.12 | 53.37 | 58.20 | 62.53 | 77.46 | 60.08 | 54.97 | |
AISC ($/tonne) | 109.68 | 68.53 | 82.63 | 99.93 | 117.83 | 87.48 | 83.36 | |
Cash cost, net of by-product credits ($/ounce of silver) | (19.93) | (29.05) | (11.44) | (0.80) | (8.53) | (14.23) | (14.71) | |
AISC, net of by-product credits ($/ounce of silver) | 10.22 | (15.66) | 4.71 | 20.02 | 15.05 | 4.70 | 3.12 | |
Metal Production | ||||||||
Silver (million ounces) | 0.1 | 0.1 | 0.1 | 0.1 | 0.1 | 0.5 | 0.5 | |
Lead (million pounds) | 1.1 | 1.7 | 1.3 | 1.1 | 0.7 | 5.2 | 5.3 | |
Zinc (million pounds) | 2.5 | 5.1 | 4.2 | 3.4 | 2.4 | 15.1 | 14.8 | |
CAPITAL EXPENDITURES AND DEVELOPMENT FOR GROWTH
Total capital expenditures in Fiscal 2026 were $124.4 million, up 44% compared to $86.6 million in Fiscal 2025 mainly due to the expenditures of $39.0 million at the El Domo Project and $4.6 million at the Kuanping project for mine construction.
Capitalized expenditures | Plant andequipment | Total Capitalexpenditures | ||||||
Ramp, DevelopmentTunneling, and other | Exploration Tunneling | Exploration Drilling | ||||||
(Metres) | ($ Thousand) | (Metres) | ($ Thousand) | (Metres) | ($ Thousand) | ($ Thousand) | ($ Thousand) | |
Year ended March 31, 2026 | ||||||||
Ying Mining District | 45,068 | $ 28,675 | 60,147 | $ 23,529 | 138,163 | $ 3,930 | $ 7,442 | $ 63,575 |
GC Mine | 3,726 | 1,885 | 7,870 | 3,018 | 20,749 | 453 | 634 | 5,990 |
El Domo | — | 45,794 | — | — | — | — | 635 | 46,429 |
Condor | — | 2,659 | — | — | 2,268 | 315 | — | 2,974 |
Kuanping | 5,724 | 3,679 | 1,838 | 588 | 1,625 | 79 | 1,079 | 5,426 |
Consolidated | 54,519 | 82,692 | 69,856 | 27,135 | 162,804 | 4,777 | 9,790 | 124,394 |
Year ended March 31, 2025 | ||||||||
Ying Mining District | 34,486 | $ 23,764 | 62,035 | $ 22,504 | 60,804 | $ 1,942 | $ 22,045 | $ 70,255 |
GC Mine | 2,607 | 1,664 | 9,559 | 3,570 | 41,335 | 889 | 606 | 6,729 |
El Domo | — | 7,166 | — | — | — | — | 305 | 7,471 |
Condor | — | 1,275 | — | — | — | — | — | 1,275 |
Kuanping | — | 543 | — | — | — | — | 284 | 827 |
Consolidated | 37,092 | 34,412 | 71,594 | 26,074 | 102,139 | 2,831 | 23,240 | 86,557 |
i) Ying Mining District
Capitalized expenditures for underground ramps, tunnels and drilling amounted to $56.1 million, plus $7.4 million for plant and equipment, compared to $48.2 million for underground ramps, tunnels and drilling and $22.0 million for plant and equipment in Fiscal 2025.
Design and construction of No. 3 Mill commenced in Q4 Fiscal 2026. With a total budget of $31.6 million, it is expected to add 3,000 tonnes per day of capacity and be commissioned in Q1 Fiscal 2028. This will meet the increasing demand for ore processing which is anticipated to reach 1.6 million tonnes per year by fiscal year 2029. With the No.3 Mill in operation, the No. 1 Mill will be decommissioned, leaving Ying with a net effective 6,500 tonnes per day of milling capacity.
Additionally, the TLP 35kV Substation and Power Line Construction Project had its construction contract signed on March 9, 2026. The project commenced on April 10, 2026. It is expected to be completed by the end of Q2 Fiscal 2027. This will significantly improve power supply quality and reliability, and will meet the power supply requirements specified in the facilities design for the renewal of its safety production permit.
ii) GC Mine
Total capitalized expenditures amounted to $6.0 million, primarily for sustaining activities, as compared to $6.7 million in Fiscal 2025.
iii) El Domo Project
Capital expenditures for El Domo totaled $46.4 million, compared to $7.5 million in Fiscal 2025. Mine development activities focused on infrastructure construction such as haul roads, an ore stockpile shed, a waste dump, process plant site preparation, a starter dam for tailing storage facility, a camp, and other site preparations.
iv) Kuanping Project
Capital expenditures for Kuanping amounted to $5.4 million, compared to $0.8 million in Fiscal 2025. Mine construction focused on ramp development for access to ore bodies and mining/exploration tunneling. It produced initial amounts of ore in Q1 2027, which was shipped to Ying's process plant for recovery of metals.
v) Condor Project
Total expenditures incurred and capitalized were $3.0 million, in which 2,268 metres of diamond drilling was completed to define and upgrade the mineral resources to support potential underground mining. The Company has applied for a small-scale mining environmental license, targeted for Q2 F2027. Once approved, the Company will commence the development of access tunnels to facilitate advanced underground exploration and resource definition.
vi) Chaarat Project
The Company paid $92 million to Chaarat to acquire 70% of ZAAV and become the operator, with the Government's company Kyrgyzaltyn holding a 30% free-carried interest. Subsequent to the quarter, the Company paid $60 million to the Kyrgyz government after it issued to ZAAV a new mining license and license agreement extending the valid period of the mining license for a further 30 years from June 25, 2032 to June 25, 2062.
CONFERENCE CALL DETAILS
A conference call to discuss these results will be held on Friday, May 29, at 9:00 am PDT (12:00 pm EDT). To participate in the conference call, please dial the numbers below.
Canada/USA TF: 888-510-2154China Toll: 864000211716International/Local Toll: 437-900-0527Conference ID: 21137
Participants should dial-in 10 – 15 minutes prior to the start time. A replay of the conference call and transcript will be available on the Company's website at www.silvercorpmetals.com.
Mr. Guoliang Ma, P.Geo., Manager of Exploration and Resources of the Company, is the Qualified Person as defined by National Instrument 43-101 – Standards of Disclosure for Mineral Projects ("NI 43-101") and has reviewed and given consent to the technical information contained in this news release.
About Silvercorp
Silvercorp is a Canadian mining company producing silver, gold, lead, and zinc with a long history of profitability and growth potential. The Company's strategy is to create shareholder value by 1) focusing on generating free cash flow from long life mines; 2) organic growth through extensive drilling for discovery; 3) ongoing merger and acquisition efforts to unlock value; and 4) long term commitment to responsible mining and ESG. For more information, please visit our website at www.silvercorpmetals.com.
For further information
Silvercorp Metals Inc.
Lon Shaver
President
Phone: (604) 669-9397
Toll Free 1(888) 224-1881
Email: investor@silvercorp.ca
Website: www.silvercorpmetals.com
ALTERNATIVE PERFORMANCE (NON-GAAP) MEASURES
This news release should be read in conjunction with the Company's Management Discussion & Analysis ("MD&A"), the audited consolidated financial statements and related notes contains therein for the year ended March 31, 2026, which have been posted on SEDAR+ under the Company's profile at www.sedarplus.ca and on EDGAR at www.sec.gov, and are also available on the Company's website at www.silvercorpmetals.com under the Investor section. This news release refers to various alternative performance (non-IFRS) measures, such as adjusted earnings and adjusted earnings per share, EBITDA and EBITDA per share, adjusted EBITDA and adjusted EBITDA per share, free cash flow, cash cost and all-in sustaining cost per ounce of silver, net of by-product credits, cash cost and AISC per tonne of ore processed, silver equivalent, and working capital. The tonnage of ore production refers to wet tonne, containing approximately 2% to 3% moisture. These measures are widely used in the mining industry as a benchmark for performance, but do not have standardized meanings under IFRS as an indicator of performance and may differ from methods used by other companies with similar description. The detailed description and reconciliation of these alternative performance (non-GAAP) measures have been incorporated by reference and can be found under section 12 – Alternative Performance (Non-GAAP) Measures in the MD&A for the year ended March 31, 2026 filled on SEDAR+ at www.sedarplus.ca and EDGAR at www.sec.gov and which is incorporated by reference here in.
CAUTIONARY DISCLAIMER - FORWARD-LOOKING STATEMENTS
This news release includes "forward-looking statements" within the meaning of the United States Private Securities Litigation Reform Act of 1995 and "forward-looking information" within the meaning of applicable securities laws relating to, among other things statements the accuracy of mineral resource and mineral reserve estimates at the Company's material properties; estimates of the Company's revenues and capital expenditures; estimated production from the Company's mines in the Ying Mining District and the GC Mine; timing of receipt of permits and regulatory approvals; availability of funds from production to finance the Company's operations; and access to and availability of funding for future construction, use of proceeds from any financing and development of the Company's properties; the amount of ore to be processed during the Chinese New Year holiday; estimated El Domo and Kuanping mine construction progress, and timing of development ore from the Kuanping project to be available for processing. By their very nature, forward-looking statements involve known and unknown risks, uncertainties and other factors that may cause our actual results, performance or achievements to be materially different from any future results, performance or achievements expressed or implied by the forward-looking statements. Forward-looking information may in some cases be identified by words such as "will", "anticipates", "expects", "intends" and similar expressions suggesting future events or future performance.
We caution that all forward-looking information is inherently subject to change and uncertainty and that actual results may differ materially from those expressed or implied by the forward-looking information. A number of risks, uncertainties and other factors, including fluctuating commodity prices; recent market events and condition; estimation of mineral resources, mineral reserves and mineralization and metal recovery; interpretations and assumptions of mineral resource and mineral reserve estimates; exploration and development programs; climate change; economic factors affecting the Company; timing, estimated amount, capital and operating expenditures and economic returns of future production; integration of future acquisitions into existing operations; permits and licences for mining and exploration in China; title to properties; non-controlling interest shareholders; acquisition of commercially mineable mineral rights; financing; competition; operations and political conditions; regulatory environment in China; regulatory environment and political climate in Bolivia and Ecuador; integration and operations of Adventus; environmental risks; natural disasters; dependence on management and key personnel; foreign exchange rate fluctuations; insurance; risks and hazards of mining operations; conflicts of interest; internal control over financial reporting as per the requirements of the Sarbanes-Oxley Act; outcome of current or future litigation or regulatory actions; bringing actions and enforcing judgments under U.S. securities laws; cyber-security risks; public health crises; the Company's investment in New Pacific Metals Corp. and Tincorp Metals Inc.; and the other risk factors described in the Company's Annual Information Form and filed with the U.S. Securities and Exchange Commission as part of the Company's Form 40-F and other filings with Canadian and U.S. regulators on www.sedarplus.ca and www.sec.gov; could cause actual results and events to differ materially from those expressed or implied in the forward-looking information or could cause our current objectives, strategies and intentions to change. Accordingly, we warn investors to exercise caution when considering statements containing forward-looking information and that it would be unreasonable to rely on such statements as creating legal rights regarding our future results or plans. We cannot guarantee that any forward-looking information will materialize and you are cautioned not to place undue reliance on this forward-looking information. Any forward-looking information contained in this news release represents expectations as of the date of this news release and is subject to change after such date. However, we are under no obligation (and we expressly disclaim any such obligation) to update or alter any statements containing forward-looking information, the factors or assumptions underlying them, whether as a result of added information, future events or otherwise, except as required by law. All of the forward-looking information in this news release is qualified by the cautionary statements herein.
A comprehensive discussion of other risks that impact Silvercorp can also be found in its public reports and filings under the Company's profile on SEDAR+ at www.sedarplus.ca, on EDGAR at www.sec.gov, and on the Company's website at www.silvercorp.ca.
Cautionary Note to United States Investors Concerning Estimates of Reserves and Resources
Reserve and resource estimates included in this news release have been prepared in accordance with NI 43-101 and the Canadian Institute of Mining, Metallurgy, and Petroleum Definition Standards on Mineral Resources and Mineral Reserves. NI 43-101 is a rule developed by the Canadian Securities Administrators that establishes standards for public disclosure by a Canadian company of scientific and technical information concerning mineral projects. Unless otherwise indicated, all mineral reserve and mineral resource estimates contained in the technical disclosure have been prepared in accordance with NI 43-101 and the Canadian Institute of Mining, Metallurgy and Petroleum Definition Standards on Mineral Resources and Reserves. Canadian standards, including NI 43-101, differ significantly from the requirements of the Securities and Exchange Commission, and mineral reserve and resource information included in this news release may not be comparable to similar information disclosed by U.S. companies.
View original content to download multimedia:https://www.prnewswire.com/news-releases/silvercorp-reports-adjusted-net-income-of-151-million-0-69-per-share-and-cash-flow-from-operating-activities-of-310-6-million-for-fiscal-2026--302782401.html
SOURCE Silvercorp Metals Inc.
View original content to download multimedia: http://www.newswire.ca/en/releases/archive/May2026/26/c3110.html