The ‘quite unusual’ platinum to palladium ratio

Story syndicated from Mickey Fulp’s Mercenary Musings.
Price ratios determine relative value of the precious metals and are useful parameters in deciding which metal to buy at any given time.
In previous musings, I documented the history of gold and silver prices and gold-silver ratios from the United States’ abandonment of the gold standard in August 1971 to present (Mercenary Musing, May 9, 2016) and followed with a similar treatment for platinum and gold (Mercenary Musing, February 6, 2017).
In today’s precious metals analysis, I focus on platinum-palladium prices and ratios over the past 48 years.
A monthly average price chart for both metals from January 1970 to December 2017 is shown below. Note that while platinum was free-trading, palladium was fixed at $35-36/oz until mid-1972. We use London pm closing prices from Kitco.com.
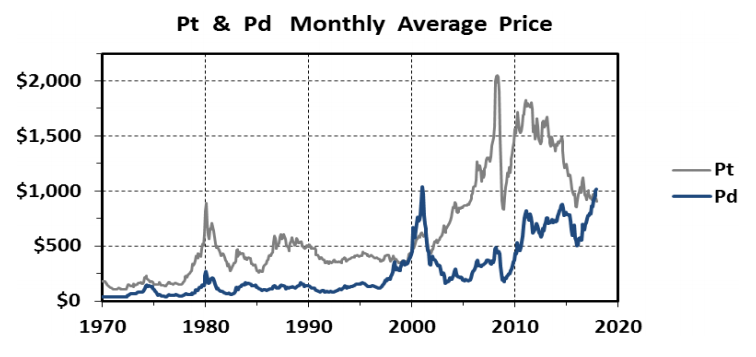
The price charts show similar patterns and a general correlation of platinum and palladium prices. That said, there have been times when one is more volatile than the other, both metals are subject to parabolic spikes, and on occasion, their prices are strongly divergent.
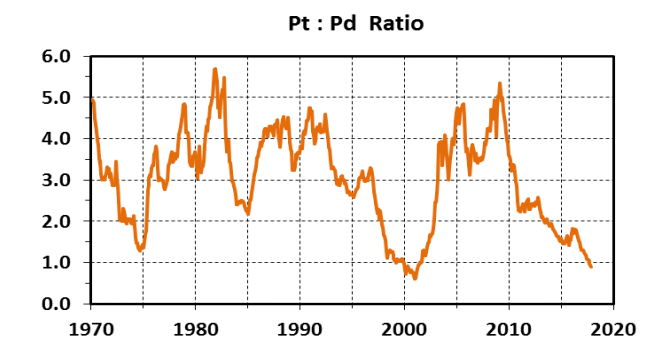
As a result, platinum to palladium ratios show wide variance over the 48-year period and range from highs above 5.0 to lows below 1.0:
Our data set covers 576 months. The distribution of ratios in both tabular and chart format follows:

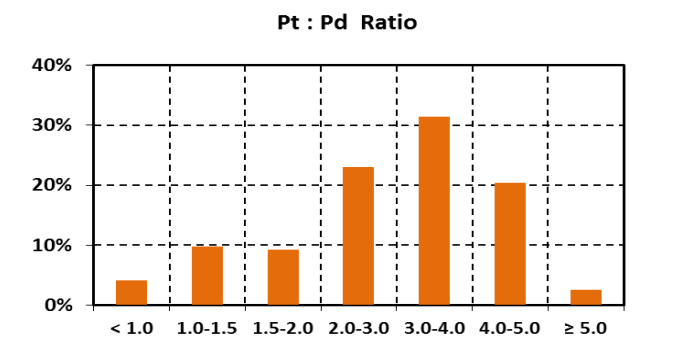
From our data set and the distributions of monthly average platinum-palladium ratios from January 1970 thru December 2017, I can glean the following:
- Ratios < 1.0 are quite unusual and occurred over 23 months or 4.0% of the time. They happened in April 1999, from early 2000 thru mid-2001, and for the last three months of 2017.
- Ratios from 1.0 to 1.5 constitute 9.7% of the record.
- Pt:Pd from 1.5 to 2.0 comprises 9.2 % of the monthly ratios.
- The ratios between 2.0 and 3.0 occur 22.9 % of the time.
- Ratios from 3.0 to 4.0 make up slightly less than one-third of the distribution at 31.6%.
- The 4.0-5.0 interval covers about one fifth (20.3%) of the months in our compendium.
- The 14 monthly outliers at >5.0 comprise 2.4 % of the total record. These abnormally high ratios occurred from the last four months of 1981 until mid-1982 and during the first four months of 2009.
Platinum and palladium are both small markets. According to the USGS, world production in 2015 was 189 tonnes of Pt and 216 tonnes of Pd and 2016 estimates are 176 tonnes and 208 tonnes respectively.
Compare these mined supplies with the 2016 production of gold at 3100 tonnes. From 1990-2016, about 4550 tonnes of platinum were mined versus 4800 tonnes of palladium. Cumulatively, these two
GM markets have been nearly equal in size over the span of 27 years for which production data is readily available.
From a compendium of sources, the average crustal abundance of both metals is around 3-4 ppb. Based solely on this fact, platinum and palladium should trade at about the same price. But they clearly do not because only 6.3% of the total record is in the range of 1.0 + 0.2. Since January 1970, the average price of platinum is $633/oz and palladium is $265/oz for an overall ratio of 2.4.
Therefore, I conclude that average crustal abundance and relative size of the markets have no influence on the price relationship of these two metals. A variety of world supply and demand factors have caused platinum to trade at a premium to palladium 96% of the time since 1970.
- Platinum is favored for jewelry and by investors because of its much higher density. For platinum, catalytic converters, electronics, petroleum and chemical catalysts, medical
technologies, and minor uses constitute about 60% of its annual demand. Around 30% is used in jewelry and 10% for investment demand. - Industrial uses of palladium are significantly higher and constitute 94% of demand. Use is dominated by the automobile market with significant demand by electronic, dentistry, and
chemical applications. Only about 5% is used in jewelry and there is a very small investment demand. - Over 70% of yearly platinum mine supply comes from South Africa, a geopolitically risky country subject to labor, power, currency, and black ownership issues. Other producers include Russia at 10-12%, Zimbabwe at 5%, Canada at 4%, and the US at less than 2%.
- Palladium supply is more diverse and less subject to single country risk. Russia and South Africa each produce on average 38-39% of world demand. Canada produces about 10%, the United States is at 5-6%, and Zimbabwe comes in at 4%.
Significant variations in the relative value of the two metals are common but extreme ratios are quite rare:
- From January 2000 to mid-2001, historic lows less than 1.0 that bottomed at 0.60 occurred when rumors spread that Russia would cease palladium sales to the West. Unhedged hoarding by an American automaker exacerbated the situation and palladium soared to over $1000/oz for about a month. But then Russia’s balance of payments suffered, palladium was dumped on the market,
and the price went parabolic. Giant American automaker Ford wrote off over $1 billion on its stockpile. - Recent lows below 1.0 are due to a palladium supply deficit driven by high demand for gasoline powered automobiles. Meanwhile, diesel demand is off due to the Volkswagen debacle and platinum supplies have been supplemented by South African stockpile sales. Palladium has been above $1000 over the past month
- Ratios on the extremely high side (>5.0) occurred when the palladium price fell below $100 in 1981-1982 and also when the automobile industry collapsed during the global economic crisis in early 2009. While palladium demand plummeted, platinum prices were somewhat sustained by safe haven buying.
Fluctuations in the relative prices of platinum and palladium are largely driven by:
- overall health and growth of the world’s economy and in particular, demand for gasoline and diesel combustion engines;
- the aforementioned geopolitical issues in South Africa that can cause major disruptions in platinum supply;
- demand for gasoline-powered automobiles in the US and China that use palladium in catalytic converters versus demand for diesel-powered automobiles, mainly in Europe, and commercial vehicles, heavy equipment, and generators that use mostly platinum;
- secondary supply for both metals with about 30% of annual supply now coming from recycling, mostly of catalytic converters; this supply is very price sensitive, especially for palladium, and can fluctuate wildly;
- safe haven hoarding of platinum in times of economic uncertainty and major geopolitical events;
- traders and speculators in the paper markets of both metals (bullion exchanges, ETFs, and
derivative markets.
Now on to more practical matters:
As my readers are aware, I view gold as the only real money. It is my safe haven and insurance policy against financial calamity. Platinum functions much more as a precious metal than palladium. In times of financial distress and economic turmoil, platinum tends to behave like gold with widespread hoarding. Palladium on the other hand, is almost exclusively an industrial metal with minor demand as a precious metal used in jewelry and investments.
The platinum-palladium ratio can ascertain whether one metal is over- or undervalued with respect to the other. The December monthly ratio below 0.89 is quite rare. In fact, ratios less than 1.0 occurred only once before in late 2000 to mid-2001. Also, the platinum to gold ratio set a historic low of < 0.72 in December.
Platinum is severely undervalued with respect to both gold and palladium but rest assured, these relationships will normalize in due course. Given the historically low ratios, I have chosen to buy platinum instead of gold over the last two years. Note however, the mark-up for platinum is two to three times higher than for gold and that additional cost is always a factor in my evaluation process.
I strive to maintain 10-20% of my net worth in physical bullion. Most is in gold but I always own platinum and silver, too. The product availability and options for buying physical palladium are much more limited than platinum and I have never chosen to own it. Despite its record high closing price of $1117/oz on January 12, I still consider palladium to be an industrial not a precious metal.
As a hoarder, my basic strategy for accumulating gold or other precious metals is to buy during downticks in price regardless of bull or bear market cycles. Folks, this is the way I see it, and the way I do it.
{{ commodity.name }}
{{ post.title }}
{{ post.date }}
Comments