Mapping the market: Metals and mining shares may be perking up

Shares of U.S. metals and mining companies have been on a volatile ride this year, including a nearly 25% fall for the sector in recent weeks, but technical analysis indicates that things could be looking up.
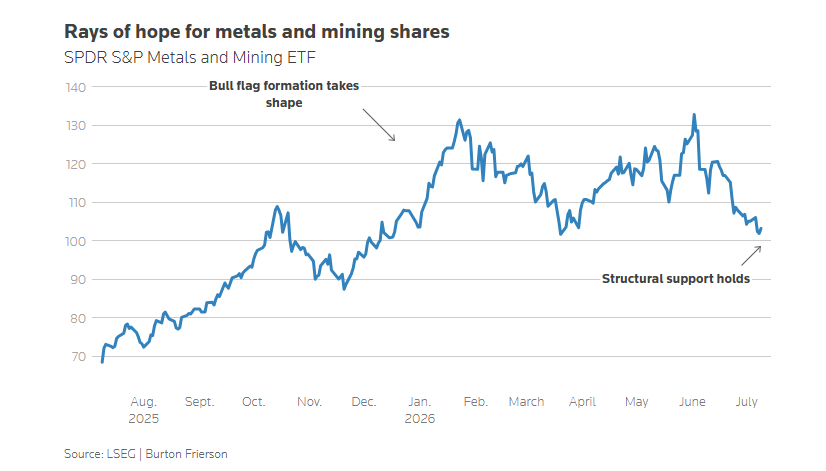
The sector, measured by the State Street SPDR S&P Metals & Mining ETF, has been in a long-term uptrend that shifted into high gear in 2025. Over the past year it has been pulled between opposing forces — tariffs, the AI-driven buildout, bets on a commodities supercycle, and worries that the war in Iran could hurt global growth and stoke inflation.
The ETF tumbled to its 2025 low of 99.95 on Wednesday, according to data supplied by LSEG, but then began rebounding. The 99.95 low marked what chartists call structural support — a price floor where buyers have repeatedly overwhelmed sellers — and the bounce suggests that support held firm.
Adding to the bullish case, the Relative Strength Index, or RSI, turned higher from oversold territory just as the rebound got underway. RSI is a widely used gauge of market momentum. When RSI turns higher from low, oversold levels, chart watchers often see it as an early clue that sellers are losing steam and buyers are stepping back in.
The recent low in the ETF also sits at the bottom of a price channel that appears to be forming a bull flag, a pattern in which a market pauses within an uptrend before resuming its climb. The top of the flag is marked by a trendline connecting January’s high of 134.46 to June’s peak of 132.87, so a breakout remains distant. Still, the rebound highlights a staircase of Fibonacci retracement levels and other resistance spots at 107.71, the 109.50-110 area, 112.51 and 116.40. Fibonacci retracement levels are points where markets often return after a big move.
A sustained break below structural support near the 99.95 low and the channel’s floor, near 99.40, would undercut this bullish case and raise the risk of further declines.
What the chart shows:
- Bounce off 2025 low of 99.95 confirms structural support
- Pattern resembles a bull flag, with the top near the 134.46 and 132.87 highs
- Key levels to watch: 107.71, the 109.50-110 area, 112.51 and 116.40; support at 99.95 low and 99.40
(Christopher Romano is a Reuters market analyst. The views expressed are his own; Editing by Burton Frierson and Nia Williams)
More News

{{ commodity.name }}
{{ post.title }}
{{ post.date }}
Comments