CHART: Yawning gap opens up between US stocks, metal prices
The nickel price may be rampant and lead, tin and even lowly bismuth are looking the healthiest in years, but the main industrial metals are limping along.
At around $3 a pound, copper is not that far off 2010-levels and aluminum seems to be caught in a long-term structural decline.
Just today iron ore dropped to 2012 lows and traders of the world’s most active steel future, Shanghai rebar, seems bent on testing the contract’s record low on a weekly basis.
This while US equities keep reaching for higher highs. As this chart from Capital Economics shows industry and the broader stock markets used to be correlated much more closely.
That link remained during and after the height of the financial crisis. But since 2012 US stocks and industrial metals prices have moved in opposite directions.
When asked about the frothy US market this week Fed chair Janet Yellen said “the broad metrics don’t suggest we’re in obviously bubble territory”.
That may be so, but the disconnect between stocks and metals could not be more obvious:
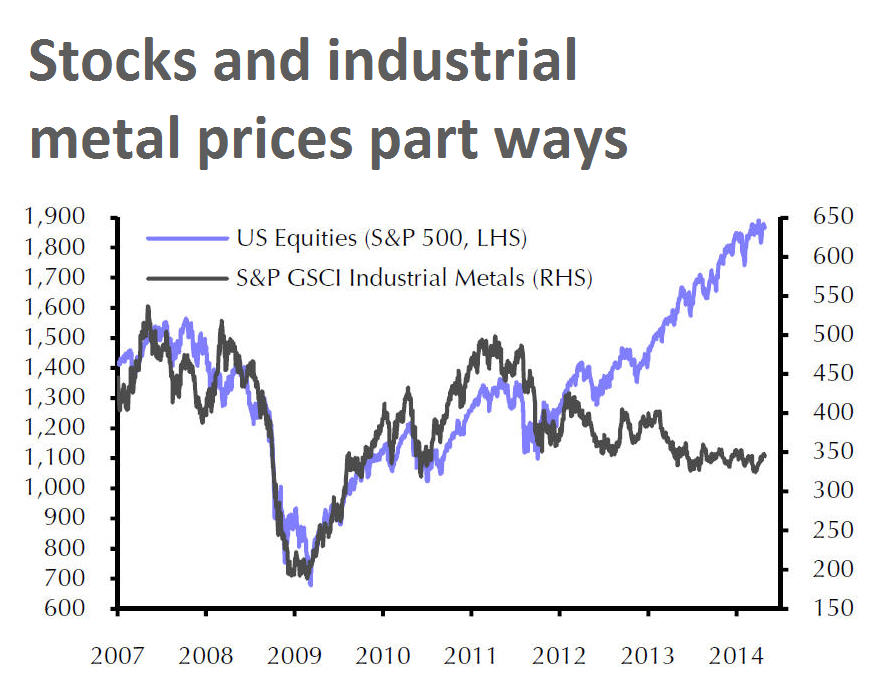
Source: Capital Economics, S&P GSCI, Thomson Datastream
More News

Column: Battery metals recovery runs into stop-start EV market
Prices of lithium, cobalt and nickel have all recovered from their 2024-2025 lows.
July 05, 2026 | 10:09 am

Zimbabwe lab sees regional gold hunt accelerate as prices soar
July 03, 2026 | 11:49 am

{{ commodity.name }}
{{ post.title }}
{{ post.date }}
Comments